Figures & data
Table 1. List of MARKAL regions and corresponding U.S. Census Divisions and states.
Figure 1. Example of NOx emissions for baseline and maximum traditional controls scenarios, as well as incrementally more stringent regional NOx constraints for Region 5, the South Atlantic.
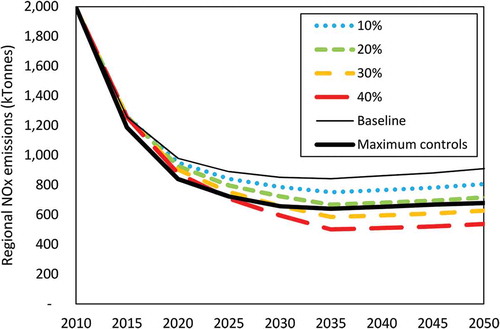
Figure 2. National MACC for NOx for 2035.
Figure 3. National, sectoral MACCs for NOx for 2035.
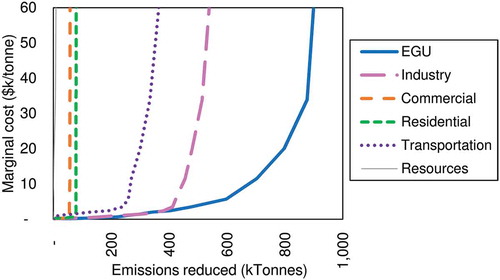
Figure 4. National MACC for NOx for 2035, as well as MACCs for reductions attributed to traditional controls and RE/EE/FS.
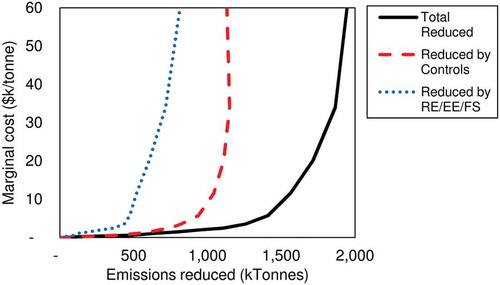
Figure 5. National electric-sector MACC for NOx for 2035, oriented with marginal cost on the x-axis.
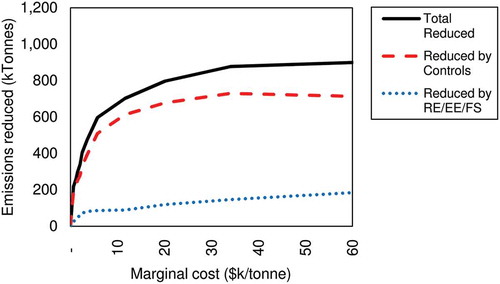
Figure 6. Change in electricity production by fuel in 2035 as a function of marginal cost. Electricity production by fuels or technologies not shown on the graphic (e.g., oil, biomass, nuclear, and hydropower) did not change.
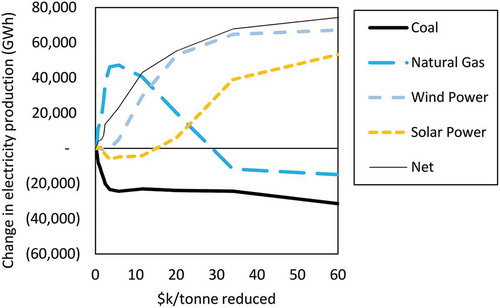
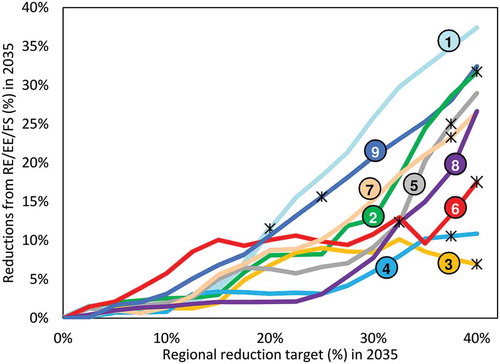
Figure 7. Regional MACCs for NOx in 2035.
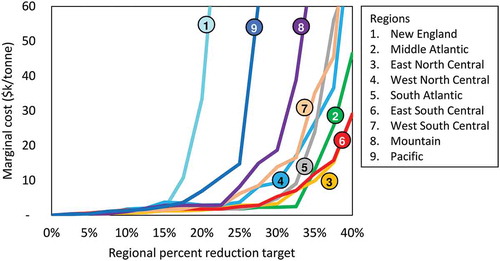
Figure 8. RE/EE/FS portion of regional MACCs in 2035 (percent of NOx emissions reduced; e.g., the combination of a 40% regional reduction target and 20% reduction from RE/EE/FS would indicate that half the reduction target was met by RE/EE/FS). The markers along each series indicate the last reduction target at which the marginal was less than $60k/tonne.