
Figures & data
Figure 1. Site map showing the PV block numbers and the locations of the four beta attenuation monitors (BAMs) that recorded the PM2.5 and PM10 readings.
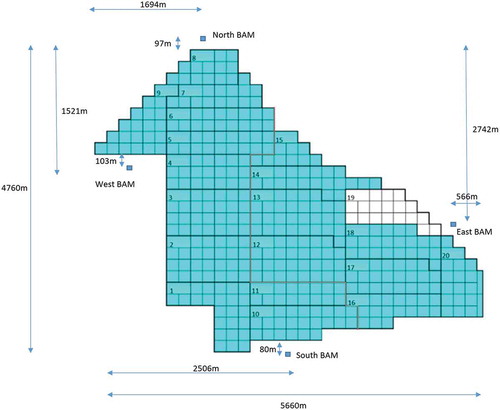
Table 1. Sample sizes, means, and standard deviations for the three groups of PM2.5 and PM10 concentration readings at the four BAM stations.
Figure 2. Time series and the corresponding linear trend equations for PM2.5 and PM10 concentrations at the four BAM stations for the construction and post-construction groups. The zeroth day, by convention, represents the first day of recording PM10 concentrations after the start of construction.
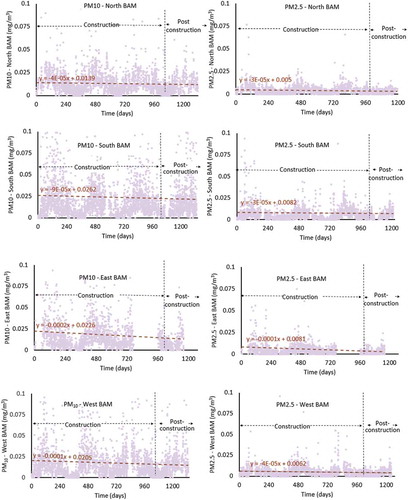
Figure 3. Confidence interval (at 95%) plots depicting the mean PM2.5 concentration levels for the background, construction, and post-construction groups recorded at the four BAM stations.
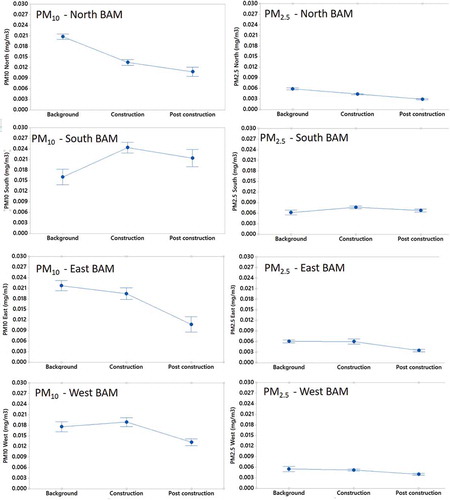
Table 2. Kruskal-Wallis test results demonstrating statistically significant differences between the median background, construction, and post-construction PM2.5 and PM10 concentrations in each BAM station at a 95% confidence interval.
Table 3. Results of the nonparametric post hoc analysis to rank the background, construction, and post-construction PM2.5 and PM10 concentrations from the four BAM stations.