Figures & data
Figure 1. Locations of notable stationary sources in Jeddah. King Abdulaziz University is the location of the air quality sampler.
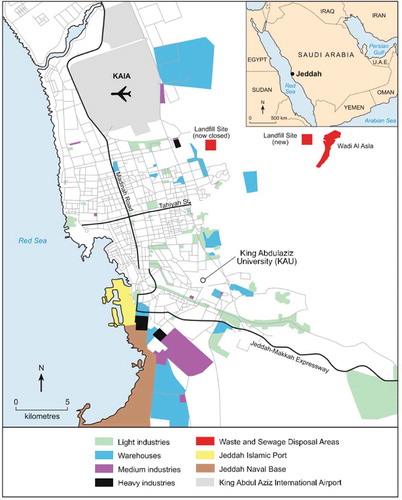
Table 1. PM levels and PM2.5/PM10 and PM2.5/PM2.5–10 concentration ratios in select cities.
Figure 2. Distributions of daily mean concentrations of (a) PM2.5 and (b) PM10, by season.
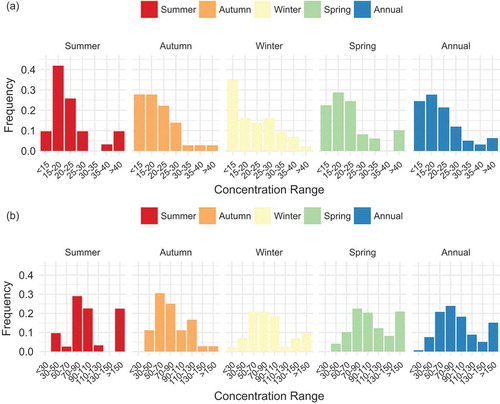
Figure 3. Monthly variations of PM2.5, PM2.5–10, and PM10 concentrations during the period of study, with error bars.
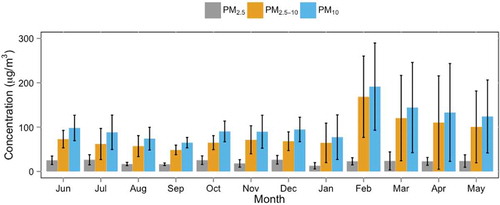
Table 2. Summary statistics for particulate matter (μg/m3) and elemental constituents (ng/m3).
Table 3. Seasonal averages ± SD for fine and coarse particulate matter (μg/m3) and elemental constituents (ng/m3).
Table 4. Weekday versus weekend averages ± SD for fine and coarse particulate matter (μg/m3) and elemental constituents (ng/m3).
Table 5. Enrichment factors (EFs) for fine and coarse particulate matter by season.
Figure 4. Sources of elements in PM2.5 and PM2.5–10 samples identified by APCA in Jeddah.
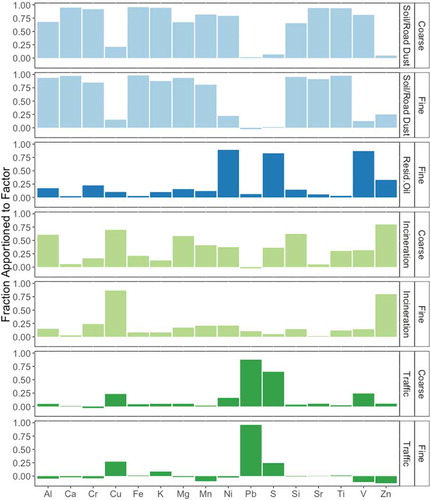
Table 6. Predicted mass means and SDs for identified factors for fine and coarse particulate matter.
Figure 5. Wind speed roses by season (a) and concentration roses for PM2.5 (b) identified source factors in Jeddah.
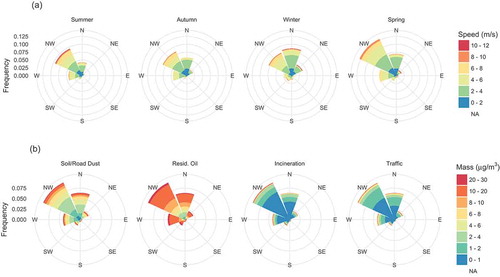
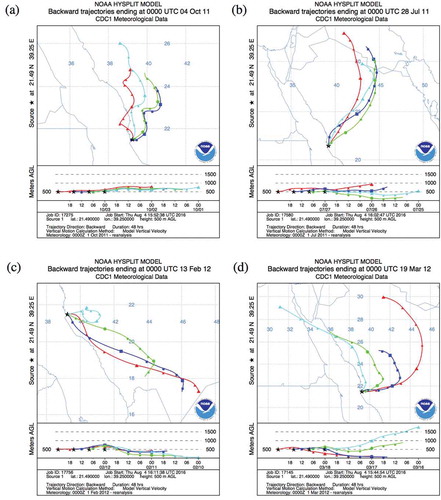
Figure 6. Representative backward trajectories at sampling location, on days with the highest concentration levels for respective estimated PM sources: (a) oil combustion; (b) incineration; (c) traffic; (d) soil/road dust.