Figures & data
Table 1. Bitumen and synthetic crude production (million m3) by facility and year for oil sands developments north of Fort McMurray with the direction from the facility to Fort McKay, and total bitumen and synthetic crude production for the Athabasca Oil Sands.
Table 2. Thresholds for determining poor air quality events.
Table 3. Results of Theil-Sen trend analysis of compound concentration percentiles from 1998 to 2014.
Table 4. Summary of the Mann-Whitney U tests of air quality changes between the early industrial (1998–2001) and late industrial (2011–2014) periods.
Table 5. Results of Spearman rank correlation analysis of compound concentration percentiles and production of bitumen or synthetic crude from 1998 to 2014.
Table 6. Results of Spearman correlation analysis to assess whether estimated emissions correlate with percentiles of ambient concentrations in Fort McKay.
Table 7. Summary statistics of poor air quality events, from 1998 to 2014.
Table 8. Results of Theil-Sen trend analysis of number of exceedances from 1998 to 2014.
Table 9. Average emissions and percent change in emissions of the noted parameters for the noted periods (tonnes/yr).
Figure 1. Oil sands regions in northeastern Alberta. Map showing the Peace, Cold Lake, and Athabasca oil sands regions, and the location of Fort McKay and the closest major urban center, Fort McMurray. Fort McKay is located at latitude 57.163, longitude −111.618.
Figure 2. The locations, names, and types of oil sands developments near Fort McKay, as of 2015.
Figure 3. Analysis of exceedances of poor air quality thresholds in Fort McKay. Shown are box plots of exceedance duration. The black line (Hours past threshold) indicates the total number of hours in exceedance, and the gray line (Number of events) indicates the total number of exceedance events. SO2 and NO2 exceedance levels are based on Lower Athabasca Regional Plan Air Quality Management Framework, and particulate matter exceedance level is based on an Alberta Ambient Air Quality Objective (AAAQO). The threshold of 2 ppb for TRS is based on the level of odor detection (Nagata, Citation2003). The thresholds for THC are based on an assumed odor threshold of 2 ppm, which translates to a nonmethane hydrocarbon level of 200 ppb. The threshold for O3 of 50 ppm is based on the Canadian Ambient Air Quality Standards (CAAQS) Management Level Yellow of 50 ppm.
Figure 4. Odds ratios of percentiles of ambient concentrations of different compounds. Shown are 99.95% confidence intervals. The odds ratios are calculated by comparing the observed with expected fractions of air quality measurements above each percentile. The dotted line represents an odds ratio of 1, indicating no increase in observations above that percentile. Note differing scales of y-axes.
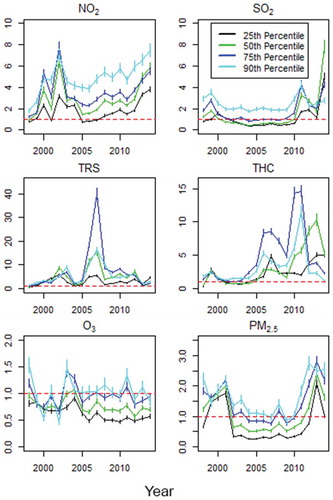
Figure 5. Henry plots of mean hourly ambient concentrations of air contaminants as a function of wind direction at Fort McKay. Shown are plots for the early industrial period (1998–2001) and late industrial period (2011–2014), with 99.99% confidence intervals. Henry plots were calculated using a modified Gaussian kernel with a 5° sliding window.
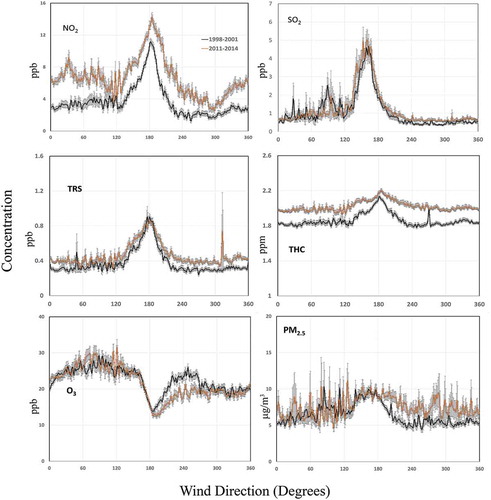
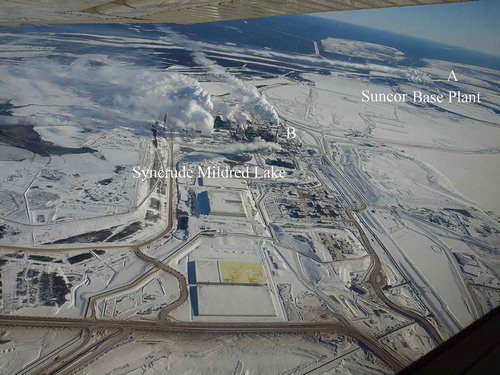
Figure 6. Aerial photo showing dispersion of plumes from Suncor base plant and Syncrude Mildred Lake. In winter, the condensing of the water vapor in emission allows a visual observation of the dispersion patterns of different emission sources. Suncor Base Plant’s flue gas desulfurization stack is 137 m high and has a base level of 255 m, whereas Syncrude’s main stack is 183 m high and has a base level of 304 m. Thus, emissions from Suncor’s stack are often trapped in the Athabasca Valley and subject to the predominant north-south valley winds, whereas Syncrude’s emissions (B) may escape this ground-level wind pattern. Photo: Ryan Abel.