Figures & data
Figure 1. Diagram of the photochemical chamber and the 3CV measuring system.
Table 1. Gasoline fuel specifications.
Figure 2. (a) New European Driving Cycle (NEDC). (b) The modified NEDC driving cycle with the additional time to complete 46 min as applied to all pilot tests and experiments.
Table 2. Exhaust EFs for both vehicles and all driving conditions as measured by 3CV sampling system.
Figure 3. Fuel consumption versus CO2 emission from both vehicles, for all phases (UDC, EUDC) and start conditions (cold or hot).
Figure 4. Average gaseous emissions for both cars and all gasoline blends as measured with the 3CV system. (a) Total hydrocarbons (THC). The standard deviation for the E22 bar is 0.58 g/km (b) carbon monoxide (CO), (c) carbon dioxide (CO2), and (d) nitrogen oxides (NOx). The standard deviation for the E22 bar is 0.027 g/km (e) methane (CH4) and (f) nonmethane hydrocarbons (NMHC). The standard deviation for the E22 bar is 0.52 g/km. The solid and dotted lines are the U.S. (Bin 4, Tier 2) and the Brazilian (PROCONVE L-6) emission standards, respectively.
Figure 5. Emissions during hot start for UDC and EUDC phases for the Ford Focus (E0, E10, E75W, and E85S) and Chevrolet Prisma (E22 and E100).
Table 3. NO concentration measured by the 3CV system and the average of the NO measurements inside the chamber at ti = 0. Standard deviation is shown in parentheses.
Figure 6. NO, [NOy − NO], and O3 concentrations, temperature, and relative humidity inside the chamber (a) for the Ford Focus using E10 and (b) for the Chevrolet Prisma using the E22 ethanol blends versus irradiation time.
![Figure 6. NO, [NOy − NO], and O3 concentrations, temperature, and relative humidity inside the chamber (a) for the Ford Focus using E10 and (b) for the Chevrolet Prisma using the E22 ethanol blends versus irradiation time.](/cms/asset/7abaffa4-bf8d-4bbe-90b6-d4a2958cd1e5/uawm_a_1386600_f0006_c.jpg)
Table 4. Maximum concentrations inside the chamber for NO, secondary NO2 (NOx − NO), and O3 and mass and time to reach the maximum for all blends.
Figure 7. Maximum concentrations measured in the chamber for all ethanol blends for (a) NO, Ford Focus; (b) NO2, Ford Focus; (c) NO, Chevrolet Prisma; (d) NO2, Chevrolet Prisma.
Figure 8. PM concentrations measured with the SMPS in the chamber before (primary) and after (secondary) irradiation. The numbers above the columns show the ratio of secondary to primary PM concentration, but for blends larger than ~10 the ratio is overestimated.
Figure 9. Secondary particle size distribution inside the chamber versus irradiation time as measured with the SMPS for the Ford Focus with (a) E0 blend, (b) E10 blend, (c) E75W blend, and (d) E85S blend. The arrow in each panel indicates when the lights are turned on.
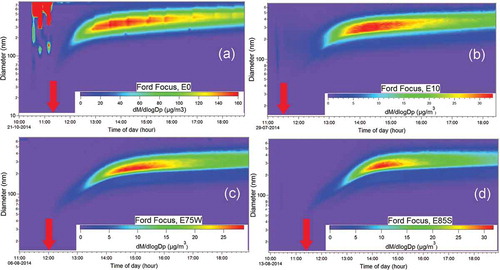
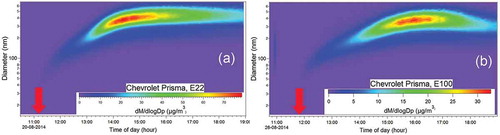
Figure 10. Secondary particle size distribution inside the chamber versus irradiation time as measured with the SMPS for the Chevrolet Prisma with (a) E22 blend and (b) E100 blend. The arrow in each panel indicates when the lights are turned on.