
Figures & data
Figure 1. Map of the study area showing the monitoring locations (CBD and UB), monitoring route, and the weather station.
Figure 2. Land use pattern at CBD.
Figure 3. Description of the monitoring route (T, R, C) characteristics. Also indicated are the location of the flyover bridge, school, as well as the traffic intersections.
Figure 4. Monthly average fixed-site PM10 concentrations at CBD during 2012–2015.
Figure 5. Personal exposure concentrations of PM2.5 during weekends and weekdays at CBD.
Table 1. Statistical summary of the weekday and weekend PM2.5 concentrations measured at CBD.
Table 2. PM exposure studies for different exposure modes in an urban environment compared with the present study.
Figure 6. Spatial map of aggregated median PM2.5 concentrations during weekends. The potential hotspots identified are marked (1, construction activity; 2, traffic intersection; 3, below the flyover).
Figure 7. Spatial map of aggregated median PM2.5 concentrations during weekdays. The potential hotspots identified are marked (1, construction activity; 2, traffic intersection; 3, below the flyover).
Figure 8. Time-series plots of PM2.5 concentrations on weekends.
Figure 9. Time-series plots of PM2.5 concentrations on weekdays.
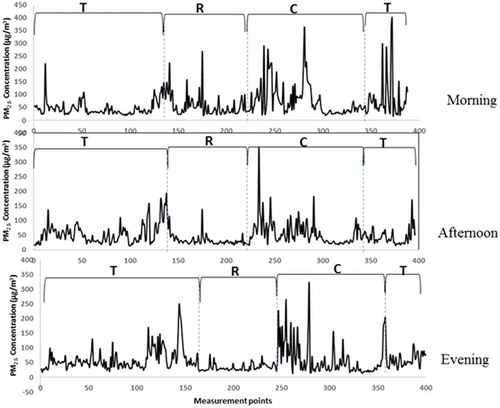
Figure 10. PM2.5 dose for various regions of lungs (head [H], tracheobronchial [TB], and pulmonary [P]) at CBD and UB.
![Figure 10. PM2.5 dose for various regions of lungs (head [H], tracheobronchial [TB], and pulmonary [P]) at CBD and UB.](/cms/asset/0718259f-2d9c-414a-9b8a-663cd4ba7c1f/uawm_a_1407837_f0010_b.gif)