Figures & data
Table 1. Weather conditions during the experimental period, including cumulative rainfall computed for the 2015–2016 winter and 10-yr averages for both temperature and rainfall.
Table 2. Statistical results for two-way ANOVAs and Tukey post hoc tests computed on total nutrient concentrations and ratios.
Table 3. Variations in C:N and N:P ratios (mean ± standard deviation) at the beginning and end of the experiment.
Figure 1. Variations in amendment total nitrogen, phosphorus, and potassium concentrations (mean ± standard deviation), reported on a dry-matter basis. Refer to for details on statistical results for ANOVAs and post hoc Tukey tests.
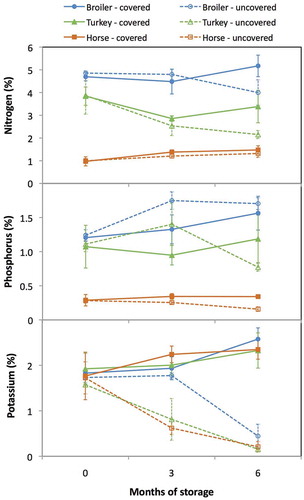
Table 4. Statistical results for two-way ANOVAs and Tukey post hoc tests computed on ammonium (NH4+-N) and nitrate (NO3−-N) concentrations.
Figure 2. Variations in amendment ammonium (NH4+-N) and nitrate (NO3−-N) concentrations (mean ± standard deviation), reported on a dry-matter basis. Refer to for details on statistical results for ANOVAs and post hoc Tukey tests.
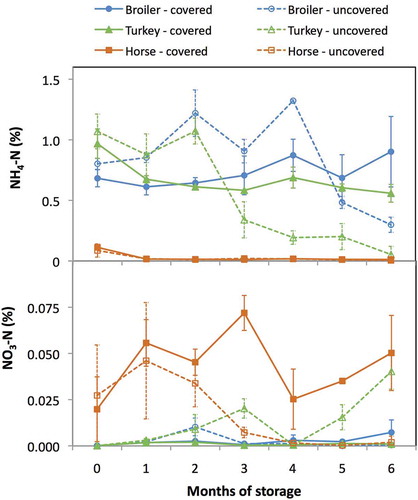
Figure 3. Variations in fluxes (mean ± standard deviation) of nitrous oxide (N2O), carbon dioxide (CO2), and methane (CH4), expressed as daily fluxes (left) or cumulative fluxes after 6 months (right). For ANOVA terms: ***P < 0.001; **P < 0.01; *P < 0.05. Colored plus signs (+) indicate a statistically significant difference (P < 0.05) between covered and uncovered piles for that specific amendment. Letters indicate a statistically significant difference among amendments, regardless of rainfall exposure (i.e., interaction terms were not significant).
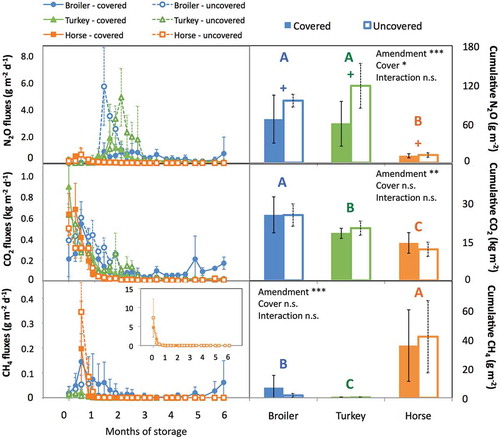
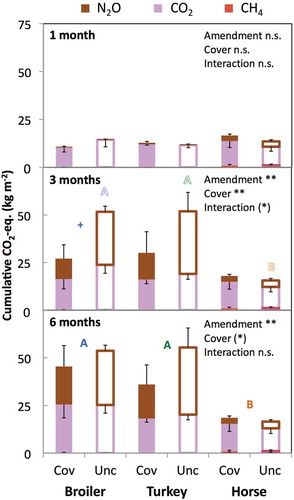
Figure 4. Cumulative fluxes (mean ± standard deviation) of nitrous oxide (N2O), carbon dioxide (CO2), and methane (CH4) expressed as CO2-equivalents after 1, 3, and 6 months in covered (Cov) and uncovered (Unc) conditions. For ANOVA terms: **P < 0.01; *P < 0.1. Colored plus signs (+) indicate a statistically significant difference (P < 0.05) between covered and uncovered piles for that specific amendment. Letters indicate a statistically significant difference among amendments at that specific time, where solid letters are used if there is no interaction (i.e., after 6 months) and white-centered letters are used when differences are found only in uncovered piles (i.e., after 3 months).