Figures & data
Figure 1. Chemical composition[s] of aerosol extinction in 2015 scaled in proportion to the square root of the total aerosol extinction for days selected as the (a) 20% haziest and (b) 20% most impaired.
![Figure 1. Chemical composition[s] of aerosol extinction in 2015 scaled in proportion to the square root of the total aerosol extinction for days selected as the (a) 20% haziest and (b) 20% most impaired.](/cms/asset/efd4c83e-49b3-4d26-a64d-5c463f305083/uawm_a_1424058_f0001_oc.jpg)
Figure 2. Seasonality (winter: December–February; spring: March–May; summer: June–August; fall: September–November) of days in 2015 selected as the (a) 20% haziest and (b) 20% most impaired.
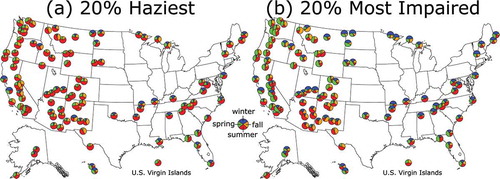
Figure 3. Significance and direction of the linear visibility trends (in deciviews) from 2000 to 2015 for days selected as the (a) 20% haziest and (b) 20% most impaired.
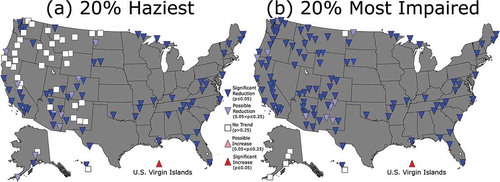
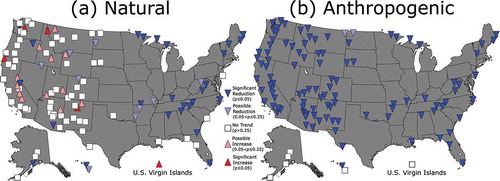
Figure 4. Chemical composition[s] of (a) natural and (b) anthropogenic aerosol extinction during the 20% most impaired days in 2015 scaled in proportion to the square root of natural and anthropogenic aerosol extinction, respectively.
![Figure 4. Chemical composition[s] of (a) natural and (b) anthropogenic aerosol extinction during the 20% most impaired days in 2015 scaled in proportion to the square root of natural and anthropogenic aerosol extinction, respectively.](/cms/asset/ed8de964-d811-48ba-8c26-5eb8dc728863/uawm_a_1424058_f0004_oc.jpg)
Figure 5. Significance and direction of the (a) natural and (b) anthropogenic (total minus natural) linear visibility trends (in deciviews) on the 20% most impaired days from 2000 to 2015.