Figures & data
Figure 1. Comparison of replicate and initial filter light attenuation at 405 nm (a and b), 635 nm (c and d), and 980 nm (e and f) for the 2016 IMPROVE (left) and CSN (right) samples.
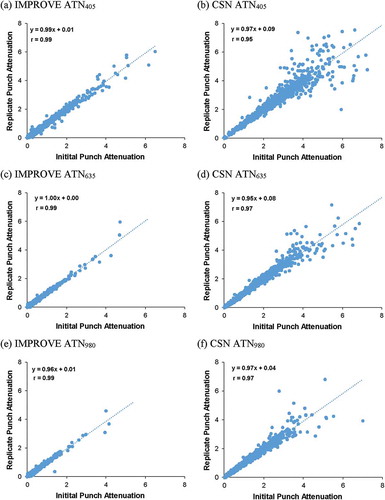
Figure 2. Attenuation at 405 nm (ATN405) versus elemental carbon by reflectance (ECR) at 635 nm (i.e., EC635) averaged over each 5th percentile range of ECR for (a) IMPROVE and (b) CSN samples.
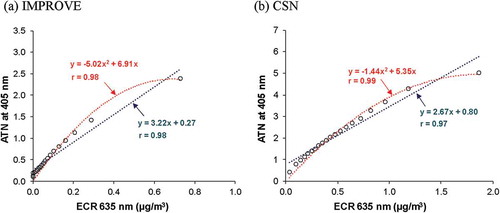
Figure 3. Power-law fit of ATN versus wavelength for each 25th percentile of EC concentrations by reflectance (ECR) for the 2016 CSN samples.
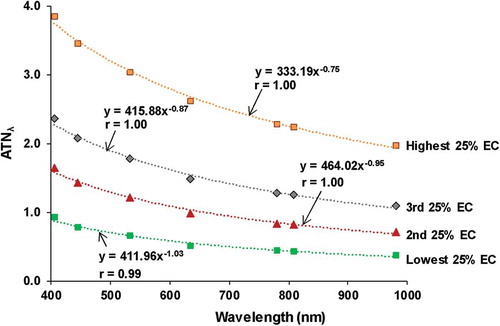
Figure 4. Spectral light attenuation and contributions from BC and BrC for source samples from diesel engine exhaust (a and b), smoldering pine cone smoke (c and d), smoldering Florida peat (e and f), and flaming pine needle smoke (g and h). The left panels depict the decomposition of total light attenuation by BC and BrC using the two-component model (eq 6), and the right panels show the percent contribution of BC and BrC to total attenuation at each wavelength. The diesel sample was collected from the exhaust of a diesel generator under idling conditions, and the pine cone, peat, and pine needle smoke samples were collected in a chamber experiment from their diluted combustion plumes (Chow et al. Citation2015). Error bars represent uncertainties derived from replicate analyses and lower quantifiable limits.
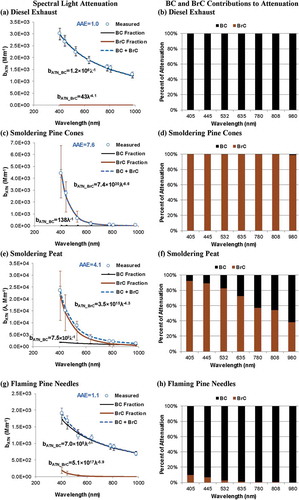
Table 1. Summary of absorption Ångström exponents (AAEs) calculated by different methods along with light attenuation coefficients (bATN) and contributions of BrC to attenuation (percent bATN_BrC) at 635 nm for the 16 source and source-dominated samples.
Figure 5. Monthly average percentage of total filter light attenuation by BrC. The IMPROVE averages exclude the network’s six urban sites and the CSN samples exclude collocated samples for the 2016 data (number of samples included in each monthly average are shown in Table S1).
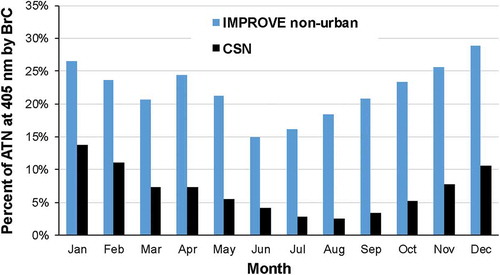
Figure 6. Network-averaged percent attenuation of BrC contribution to light attenuation at different wavelengths for the 2016 IMPROVE and CSN samples. The wavelength ratios at 405 and 635 nm are used to derive the power-law fit of bATN.
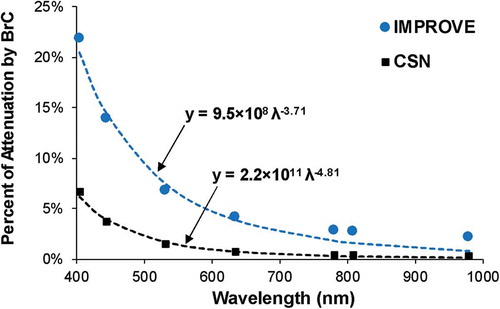
Figure 7. Frequency distributions as a function of percent attenuation by BrC at (a) 405 nm for IMPROVE, (b) 405 nm for CSN, (c) 635 nm for IMPROVE, and (d) 635 nm for CSN.
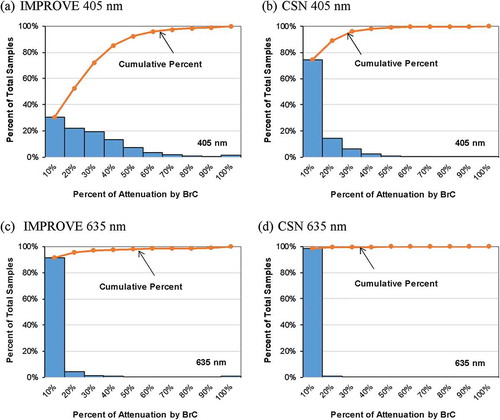
Figure 8. Monthly average bATN values at 405 nm by (a) BC and (b) BrC for IMPROVE and CSN networks (number of samples included in each monthly average are shown in Table S1).
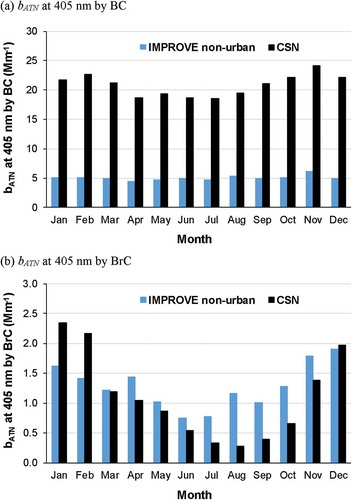
Figure 9. Time series of bATN at 405 nm by BC and BrC along with AAEs at (a) Fresno and (b) Kaiser Wilderness, California.
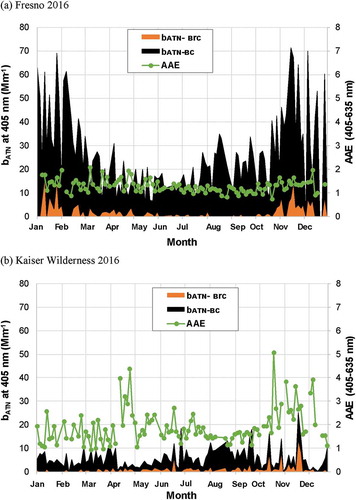
Figure 10. Time series of bATN at 405 nm by BC and BrC along with AAEs at (a) Bronx, New York; and (b) Mohawk Mountain, Connecticut.
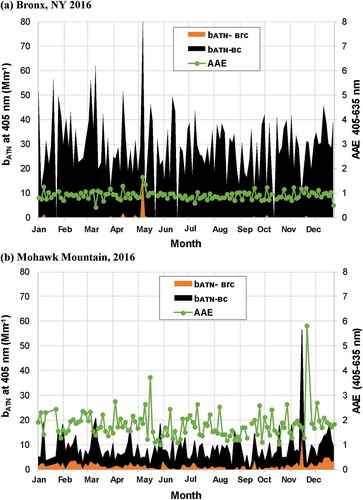
Figure 11. Time series of (a) OC and EC concentrations and (b) light attenuation by BC and BrC along with AAEs at the Everglades National Park IMPROVE site during 3/22/2016–6/20/2016, including the Long Pine Key wildfire period of 4/10/2016–4/17/2016. The inset in panel a shows the same OC and EC data with y-axis zoomed to show lower concentrations.
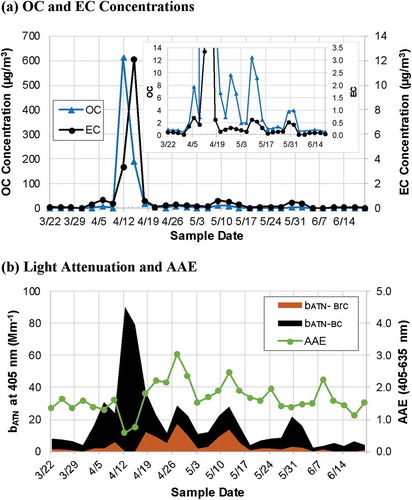
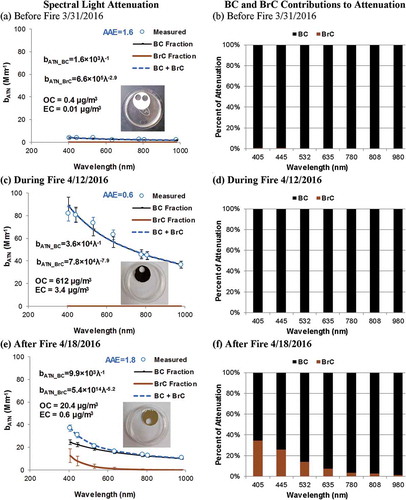
Figure 12. Spectral light attenuation contributions from BC and BrC before (a and b), during (c and d), and after (e and f) the Long Pine Key wildfire in the Everglades National Park. The left panels depict the decomposition of total light absorption by BC and BrC using the two-component model, and the right panels show the percent contributions of BC and BrC to total attenuation at each wavelength. The corresponding filter samples (one or two punches removed for carbon analysis) are also shown. Error bars represent uncertainties derived from replicate analyses and lower quantifiable limits.