Figures & data
Figure 1. Number of unhealthy days summed by county in the state of California reported during the year 2016. Air districts outlined in black. Summed days includes those surpassing an Air Quality Index (AQI) score of 100. According to the EPA (Citation2018), “When AQI values are above 100, air quality is considered to be unhealthy—at first for certain sensitive groups of people, then for everyone as AQI values get higher.” AQI values are derived from monitoring records for the major pollutants across the United States. The EPA converts raw measures into an AQI value for each pollutant and then the highest of these values for each location is recorded as that day’s AQI value for that location (EPA Citation2018). Source data: U.S. EPA AQI gathered in July 2017 by authors.
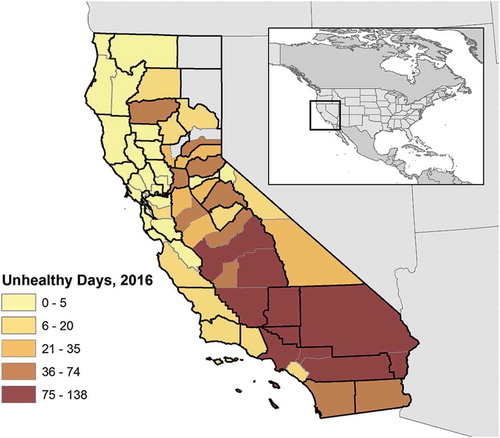
Table 1. Major pollutants reported by respondents from the open-ended question: “What are the major air pollutants of concern?”
Table 2. Response summary for the question: “In considering your district’s jurisdiction, how serious of a problem are the following air pollutants?” Pollutant options listed include those shown in the row headers; N = 30 respondents from unique districts.
Figure 2. Responses to question about the weather and environmental events that affect the air quality in the respondents’ districts. “Which types of weather or environmental events currently affect your district’s air quality? Select all that apply.”
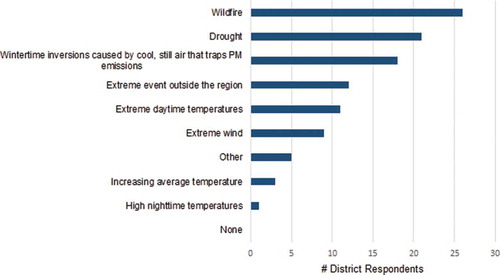
Table 3. Response counts to the question “Please indicate which weather or environmental events, if any, worsen or trigger each air quality issue in your district’s jurisdiction. Select all that apply.” The options provided are listed as column headings. Cells contain raw counts of co-occurring responses based on the row count totals; N = 30, but respondents selected all that apply.
Figure 3. Survey respondents’ perceptions and perspectives on climate change based on their reported level of agreement with the following statement: “Climate change poses risks to air quality globally.” Counts based on responses from unique air districts (N = 28), organized by attainment status. “Full attainment” indicates those districts that were in attainment of all pollutant standards for the years 2014 through 2016. “Some non-attainment’ refers to districts that were determined to have nonattainment status for one or more regulated pollutant during the years 2014 and 2016 (based on records from EPA Green Book 2017).
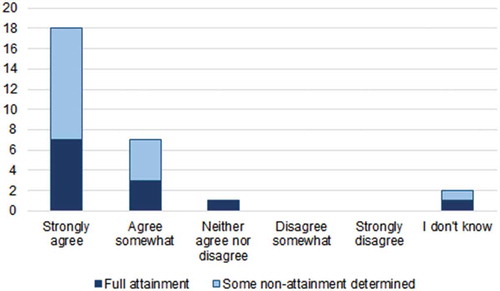
Figure 4. Responses to the question “Which of the following impacts of climate change do you expect to threaten or improve your district’s air quality and its management in the next 50 years? Select all climate impacts that apply.? Select all that apply.”
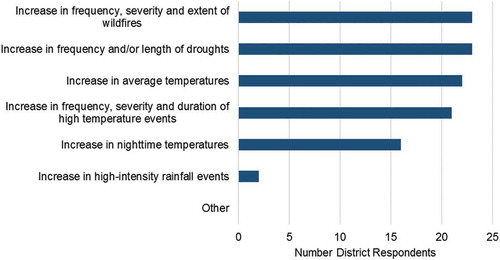
Table 4. Responses to the question: “Do you foresee the number of exceptional events that your air district applies for increasing in the future?”
Table 5. District responses on whether they model air quality cross tabulated with summarized level of attainment status. Full attainment refers to those districts that meet the National Ambient Air Quality Standards (NAAQS). “Full attainment not achieved” refers to districts that fail to meet the NAAQS for one or more pollutant for the years 2014 through 2016.
Figure 5. Responses of unique districts (N = 26) to the multiple-choice question of “Do you communicate with climate experts?”
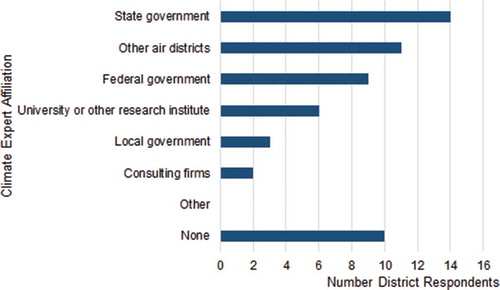
Figure 6. Districts reporting participation activities related to climate adaptation (question allowed for multiple selections other than “no action”). Survey question: “In terms of preparing for climate change impacts on air quality, select all of the statements below which best describe your district’s activities to date.”
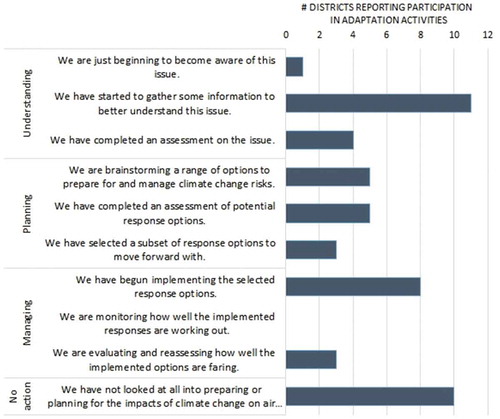
Figure 7. Responses of unique districts for the following question: “If any, we’d like to know what strategies you are considering or implementing to manage climate impacts. Select all that apply” (N = 27).
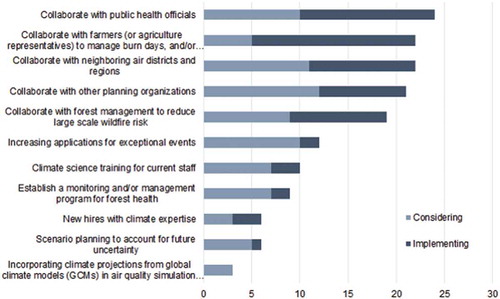
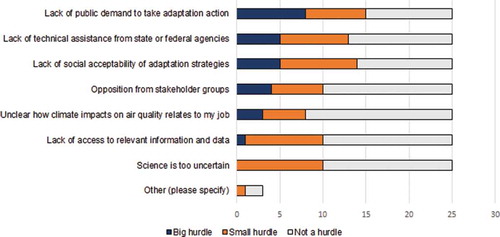
Figure 8. Responses (by district count) to the question “Have any of the following institutional, financial and other issues been a hurdle in your efforts to prepare for the impacts of climate change?”
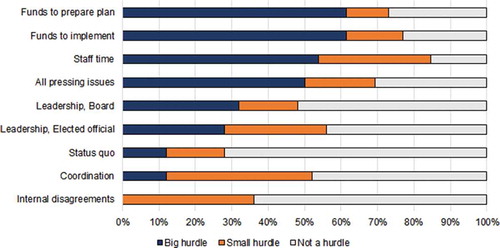
Figure 9. Responses by district count to the question “Have any of the following scientific or planning issues been a hurdle in your efforts to prepare for the impacts of climate change?”