
Figures & data
Table 1. The measured PMs fraction and brief information on the monitoring stations located along the Kaoping River.
Figure 1. Location of AD monitoring stations for PM10 (i.e., manual sampling sites, including XS: Xinsing Elementary School; YT: Yutian Elementary School; FM: Fo-Guang-Shan Buddha Memorial Center; KC: Kaoping River Weir Management Center) and AQMSs for PM2.5 and PM10 (LY: Linyuan Station; DL: Daliao Station; PT: Pingtung Station; MN: Meinong Station) distributed along the Kaoping River in southern Taiwan.
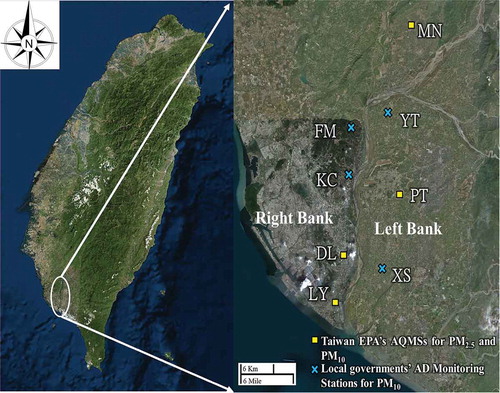
Figure 2. (a) Location of sites for collecting alluvium soils along Kaoping River. (b) Resuspension chamber used for collecting resuspended fine (PM2.5) and coarse (PM2.5–10) particles.
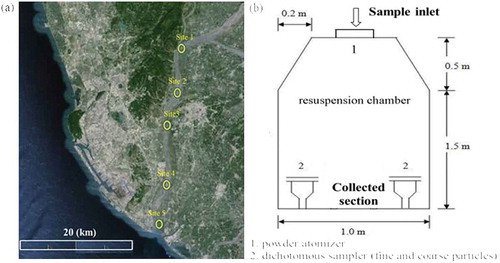
Figure 3. Wind direction and hourly PM10 concentrations of (a)–(d), (e)–(h), (i)–(j), and (m)–(p) were measured on July 2, 24, and 30 and August 6, 2013, in the S-type ADEs; (q)–(t) and (u)–(x) were recorded on August 21 and October 6, 2013, in the NW-type ADEs. The lines of each circular layer illustrate different PM10 concentrations, which gradually increase from the inner circle to the outer circle, whereas the dots represent the wind directions and PM10 concentrations.
Figure 4. Simulated hourly surface wind fields on July 2, 24, and 31 and August 6 during the S-type ADE periods (a–d) and on August 21 and October 6 during the NW-type ADE periods (e–f).
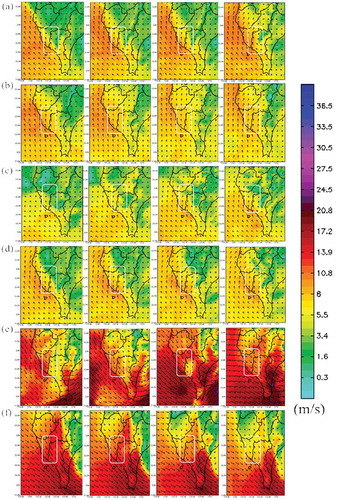
Figure 5. Diurnal variations of PM10 were recorded at AQMSs on July 2, 24, and 31, August 6 and 21, and October 6, 2013, during the six ADEs (LY: Linyuan Station; DL: Daliao Station; PT: Pingtung Station; MN: Meinong Station).
Figure 6. Variations of PM2.5, PM10, and ratios of PM2.5–10/PM10 recorded at some specific monitoring stations, the most influenced by aeolian dust, during and after the episodes (labels on the left corner represent ADE type–AQMS–sampling date).
Table 2. Metallic contents of resuspended alluvium soils collected in the Kaoping River.
Table 3. Concentrations of PM2.5, PM2.5–10, and PM10 during and after the S- and NW-type ADEs at the manual sampling sites.
Figure 7. Metallic contents and mass percentage of CM in PM2.5 and PM2.5–10 at manual sampling sites (a) during and (b) after the S- and NW-type ADEs.
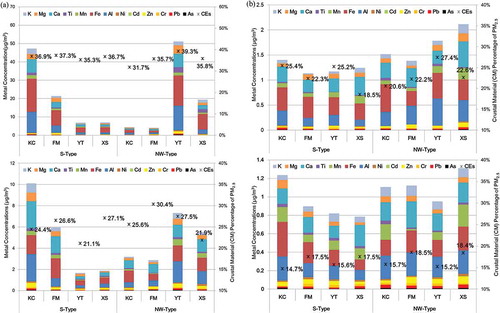
Figure 8. EF values for selected metals with Al as reference elements in PM2.5 and PM2.5–10 obtained during and after (a) S-type ADEs and (b) NW-type ADEs.
Table 4. The mass ratios for the crustal elements (Ca, Al, and Fe)/Cd in PM10 during and after the ADE periods.
Table 5. Comparison of metallic element ratios in PM2.5–10 and PM2.5 during and after the S- and NW-type ADEs at four manual sampling sites.