Figures & data
Figure 1. CONUS 12 km CAMx modeling domain (from EPA Citation2015).
Table 1. Maximum concentration limits for ozone precursors applied to the 36 km lateral boundary condition grid cells across the Gulf of Mexico, Caribbean Sea, and the Atlantic Ocean south of Cape Hatteras (from Kemball-Cook et al. Citation2015).
Table 2. CB05 to CB6 mapping.
Table 3. CMAQ and CAMx model performance statistics for MDA8 ozone concentrations for April–October 2011.
Figure 2. 2011 Design Value Current (DVC) and 2030 Design Value Future (DVF) 8-hr ozone design values at selected monitoring locations over the U.S. from the CMAQ results.
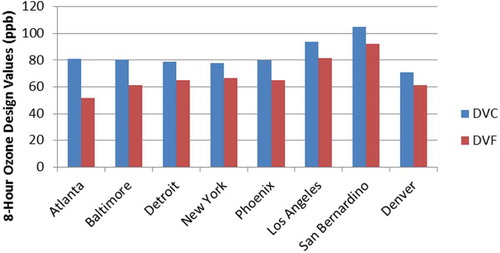
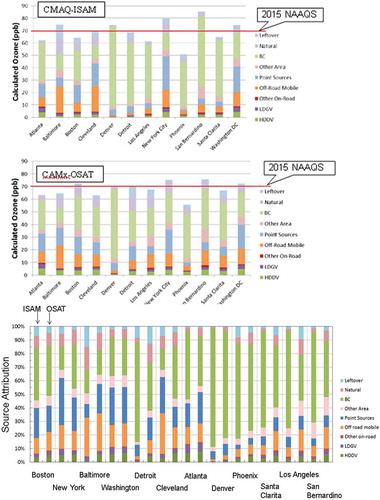
Figure 3. Future year (2030) contributions by source category to first highest July MDA8 ozone concentrations at 12 locations in the western and eastern U.S. The top panel shows CMAQ-ISAM–estimated absolute contributions, the middle panel shows CAMx-OSAT–estimated absolute contributions, and the bottom panel shows the relative source contributions for the two source attribution approaches.