Figures & data
Figure 1. VISSIM MOVES integration process.
Figure 2. Turning movement count data for the corridor.
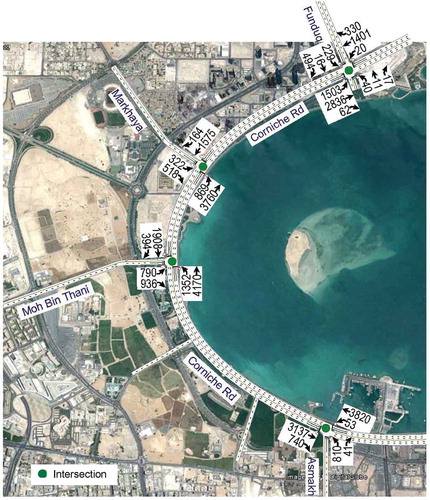
Table 1. Intersections and roadway segments in the before and after conditions.
Figure 3. (a) VISSIM screenshot showing the corridor layout. (b and c) VISSIM screenshot showing (b) the before case (roundabout) and (c) the after case (signalized intersection).
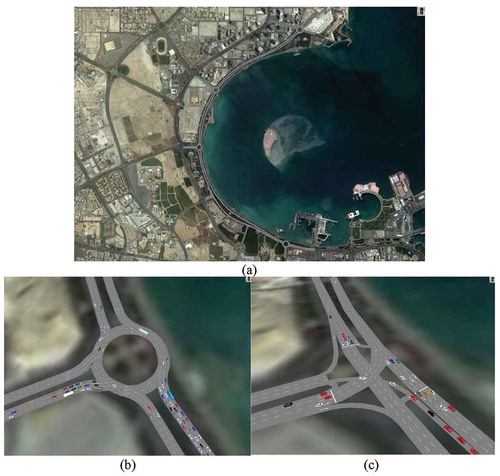
Table 2. Emissions by control type, link, pollutant, and source type.
Figure 4. (a) CO2, (b) CO, and (c) NOx emissions by vehicle and control types.
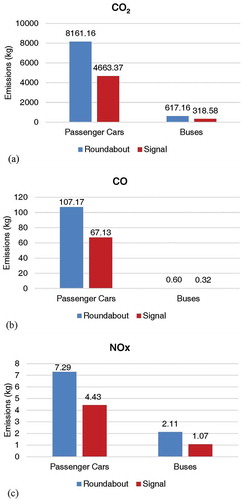
Figure 5. (a) Total emissions variation on corridor links for roundabouts. (b) Emissions rates variation on corridor links for roundabouts.
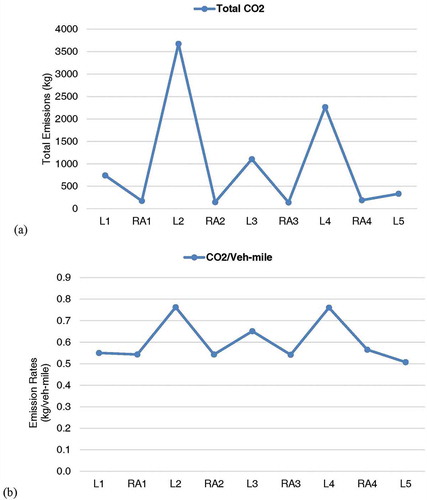
Figure 6. Link operating mode distribution on selected links (L2, RA2, L3) for roundabouts.
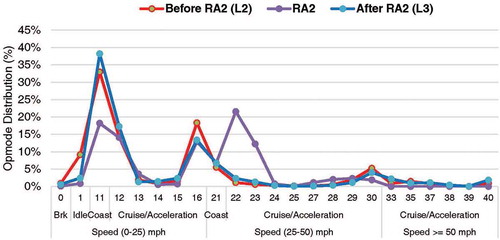
Figure 7. (a) Total emissions variation on corridor links for intersections. (b) Emission rates variation on corridor links for intersections.
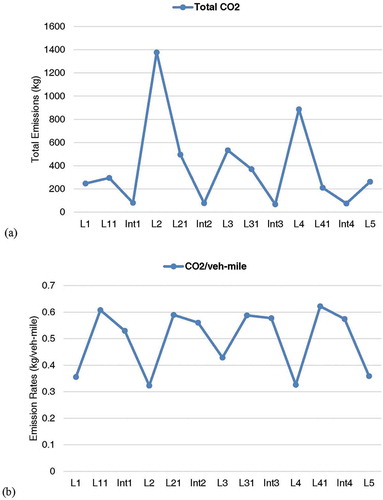
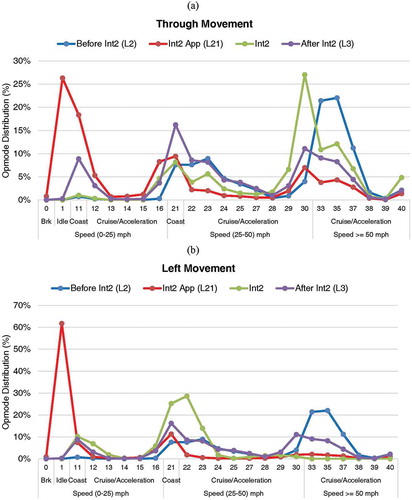
Figure 8. Link operating mode distribution on selected links (L2, L21, Int2, and L3) for (a) the through movement and (b) the left movement.