
Figures & data
Figure 1. Procedure for estimating spatially and temporally resolved mobile source indicators.
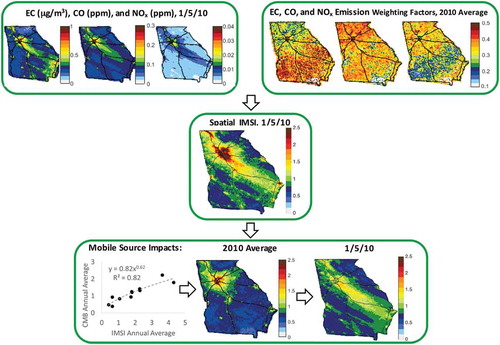
Figure 2. Spatial distributions of annual average emissions at 4 km resolution for mobile sources and total emissions.
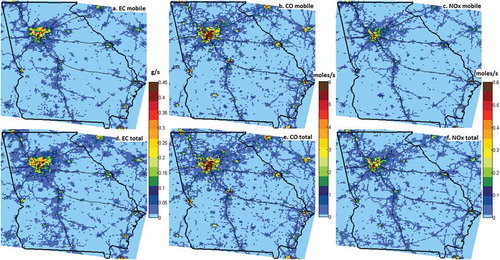
Figure 3. Distribution of weighting factors (eqs 4–6) at all grid cells in Georgia domain at 4 km and 12 km resolutions for mobile sources using annual average emissions.
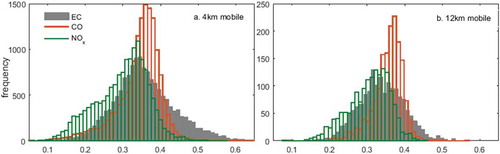
Table 1. Power fit regression (y = axb, where y = CMB and x = IMSI) coefficients for calibrating annual average indicators to annual average CMB source impacts.
Figure 4. Daily source impact (µg/m3) spatial distribution on January 21, 2008, at 12 km and 4 km resolutions for mobile source, GV, and DV.
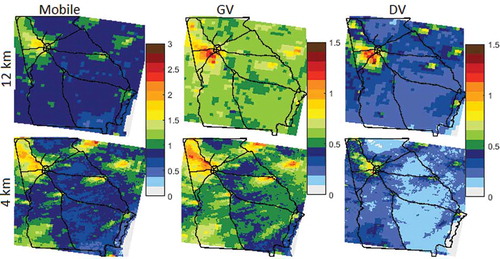
Figure 5. Weekly trends of estimated source impacts (µg/m3) in 2008 at JST (solid lines) and YRK (dashed lines) sites for comparison of the source impacts estimated by the global IMSI method and CMB estimates. JST is an urban site in Midtown Atlanta, and YRK is a rural site about 70 km away from Midtown Atlanta.
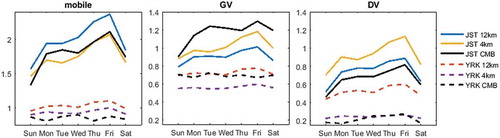
Table 2. Bias (NMB), error (NRMSE), and spatiotemporal correlation (R2) for mobile source, GV, and DV impacts on PM2.5 in comparison with CMB source impacts using the IMSI method.
Figure 6. Daily mobile source impacts estimated by CMB and by the global IMSI method (µg/m3) at all sites and years for total mobile, GV, and DV in 12 km resolution (2002–2008) and 4 km resolution (2008–2010).
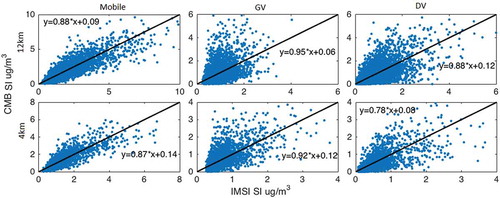
Table 3. Correlations (R) between temporal variations of the daily source impacts estimated by the IMSI method and CMB source impacts.