
Figures & data
Table 1. The basic situation of the power plants.
Table 2. The description of the sampling sites.
Figure 1. Schematic diagram of sampling point position.
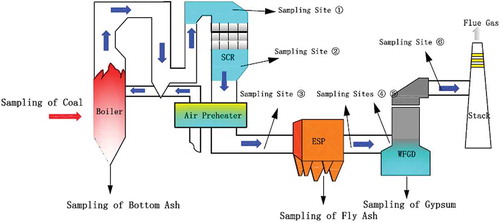
Table 3. Analysis results of coal samples.
Table 4. Mercury concentration in flue gas.
Table 5. Mercury in combustion products of each power plant.
Figure 2. The mercury mass balance and the distribution of mercury in each power plant.
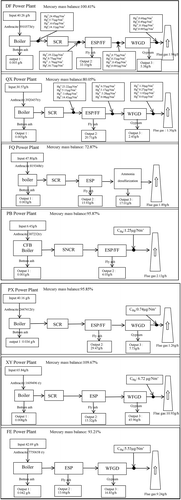
Figure 3. Distribution of mercury in the by-products of coal combustion and APCDs.
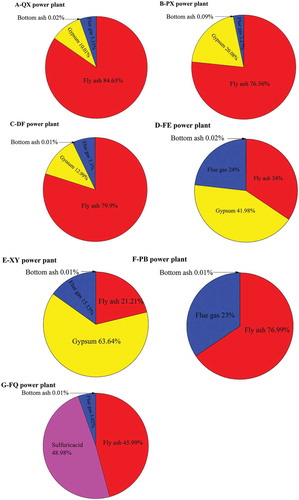
Table 6. The overall mass flow rate of each stream of each power plant.
Supplemental material