
Figures & data
Figure 1. (a) Geographic location of the region of Madrid. (b) Landfill cell distribution.
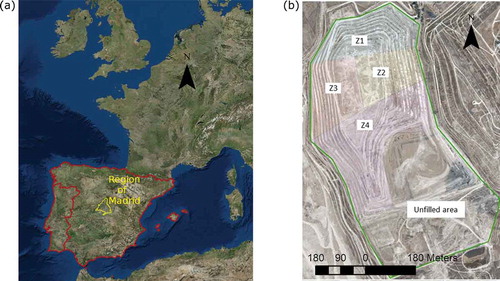
Figure 2. (a) Diagram of flux box components. (b) Flux box during a landfill measurement.
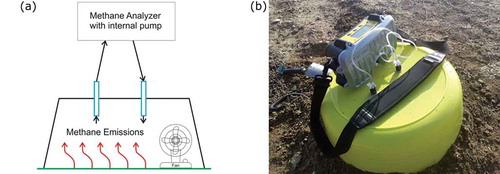
Figure 3. Variogram of the log-transformed above-zero emissions. The horizontal line evidences data independence.
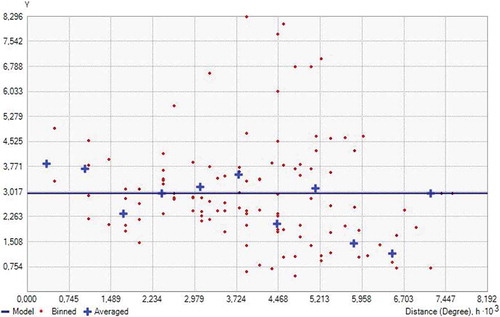
Table 1. Input parameters of waste composition used in models for estimating methane emissions.
Table 2. Tons of methane extracted by the degassing system each year reported by the company that manages the landfill.
Table 3. Default parameters for DOC, DOCf, k, MCF, and F for each landfill category.
Figure 4. (a) Walkover survey results. (b) Interpolation of walkover survey results using the weighted inverse distance method.
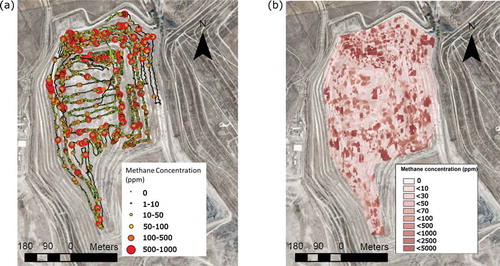
Table 4. Summary of walkover survey methane concentrations in ppm.
Figure 5. Locations of sampling points for the flux box campaign.
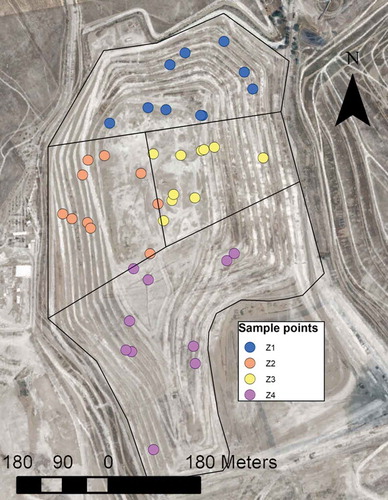
Table 5. Methane emissions (mg/m2·hr) at each sampling point.
Figure 6. (a) Q-Q diagram for nonzero data population. (b) Histogram of frequencies and cumulative frequency graph for walkover survey results.
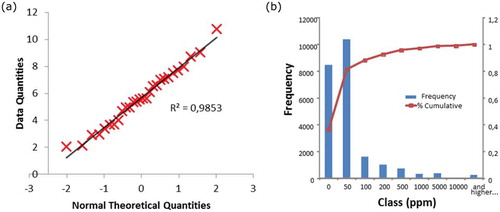
Figure 7. Comparison between modeled and measured annual emissions.
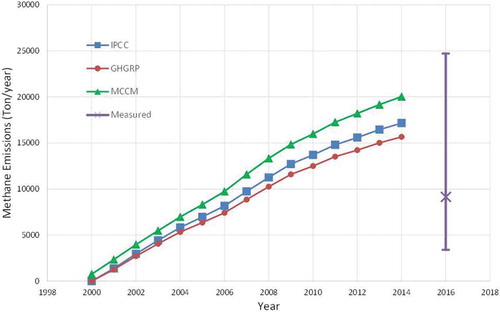
Table 6. Meteorological conditions during the measurement campaign.