
Figures & data
Table 1. Indicators of ambient CO air quality for two counties on the San Francisco Peninsula during the first year of each survey period.
Table 2. CO emissions (tons per day, annual average) for the San Francisco Bay Area by decade.
Table 3. Descriptive statistics of measured net in-vehicle CO concentrations (ppm) for four field surveys based on 50 matched cases from each survey.
Table 4. Light-duty vehicle exhaust emission standards in grams per mile (g/mile) for carbon monoxide by model year for California and the other 49 states.
Figure 1. One-minute average net CO concentrations for four matched trips in early June of each survey period.
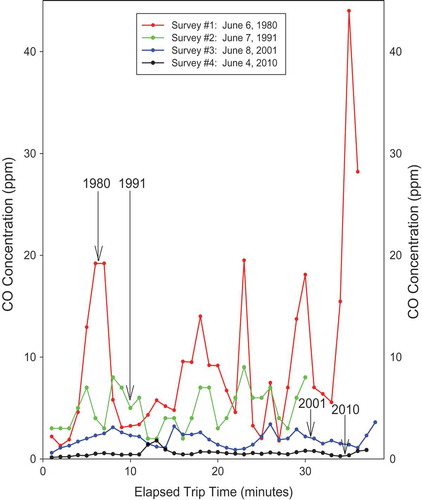
Table 5. Four traffic indicators by field survey.
Table 6. Model parameters obtained by fitting the lognormal model to the net in-vehicle CO frequency distributions using linear regression.
Figure 2. Logarithmic-probability plots of net in-vehicle CO concentrations for four field surveys. The dots are the measured in-vehicle mean net CO trip concentrations on each field survey, including the outliers, and the straight lines are the lognormal models fitted to these data, along with their geometric means (μg) and their geometric standard deviations (σg).
Figure 3. A time-series plot of the mean net in-vehicle CO exposures for the 50 trips matched from each of the four field surveys of El Camino Real to reduce the influence of traffic and weather conditions.
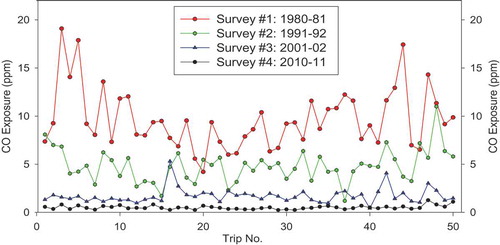
Figure 4. Mean net in-vehicle CO exposure measured on El Camino Real versus the annual average CO exhaust emission rates for four field surveys compared with dashed line fitted by linear regression.
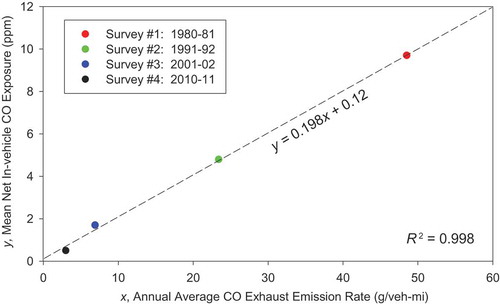
Figure 5. VMT-weighted average CO running exhaust emission rates for Santa Clara and San Mateo counties, the San Francisco Bay Area Region, and the state of California for the 1990 to 2010 period.
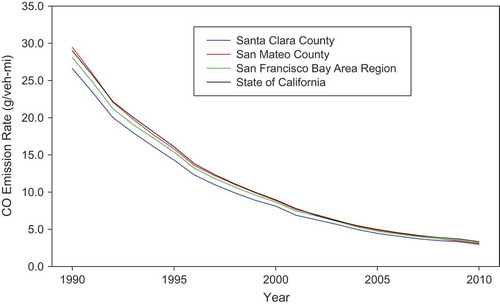
Table 7. In-vehicle CO concentrations and the estimated annual average CO exhaust emission rates by county and survey period.
Table 8. Ambient CO concentrations (ppm) at nearest fixed site monitor by field surveya.