Figures & data
Table 1. Sum of CODs for PM2.5 and PM10 in the MMA.
Figure 1. Location of all monitoring stations in the MMA, with sampling sites (red circles) and nonsampling sites (gray circles) for PM2.5 and PMc.
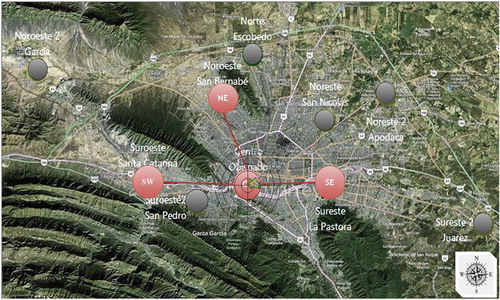
Figure 2. Wind rose diagrams for all sampling sites in the MMA.
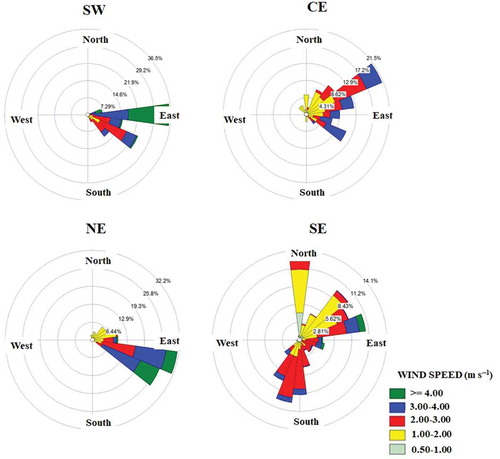
Table 2. Average ambient concentrations of PM10 and PM2.5.
Figure 3. Time series for airborne particle concentrations. Gaps in the time series indicate that samples were not taken on those dates due to the movement and maintenance of the sampling equipment.
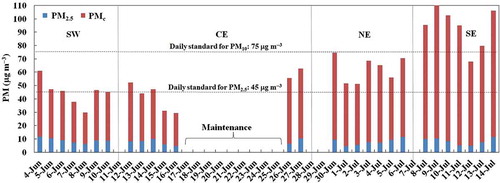
Table 3. Individual correlations (R2) for each sampling site.
Figure 4. Overall correlations and comparisons between sampling sites for PMc: (a) OC vs. EC, (b) K vs. K+, (c) S vs. SO42–, (d) cations vs. anions, (e) sum of 35 metals vs. PMc, and (f) Cl vs. Cl–. The average errors are OC (16 ± 3%), EC (22 ± 5%), K (19 ± 6%), K+ (14 ± 3%), S (20 ± 2%), SO42 – (24 ± 3%), cations (> 100%), anions (19 ± 4%), metals (20 ± 5%), and PM2.5 (8 ± 1%).
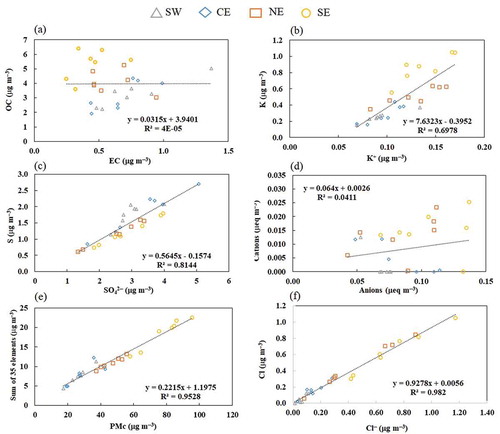
Figure 5. Overall correlations and comparisons between sampling sites for PM2.5: (a) OC vs. EC, (b) K vs. K+, (c) S vs. SO42–, (d) cations vs. anions, (e) sum of 35 metals vs. PM2.5. The average errors are OC (9.5 ± 0.6%), EC (12 ± 2%), K (43 ± 14%), K+ (7.1 ± 0.6%), S (11 ± 0.6%), SO42 – (7.1 ± 0.02%), cations (9.5 ± 1.2%), anions (7.4 ± 0.1%), metals (51 ± 12%), and PM2.5 (7.9 ± 1.2%).
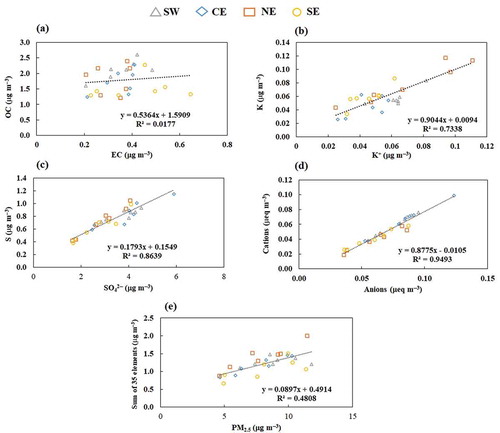
Table 4. Average elemental sulfur (S) to sulfate-sulfur (SS) ratios for each sampling site across the MMA.
Figure 6. Relative contribution (%wt) of the chemical species in the PMc samples at each site.
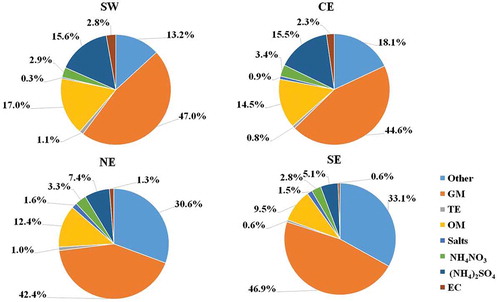
Figure 7. Relative contribution (%wt) of the chemical species in the PM2.5 samples at each site.
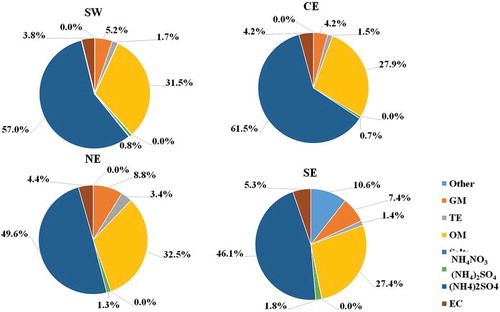
Table 5. Comparison of PM2.5 and PMc contributions with those reported by other MMA studies.
Table 6. Average OC and EC concentrations and OC/EC ratios for PMc and PM2.5.
Table 7. Average SOA contributions for PMc and PM2.5 in the MMA.
Figure 8. Enrichment factor value for PMc using the concentration of the trace elements in the four sampling sites in the MMA, taking Ca as reference element.
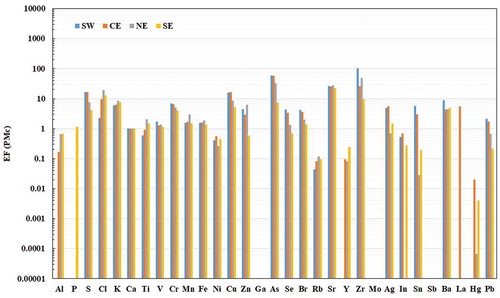
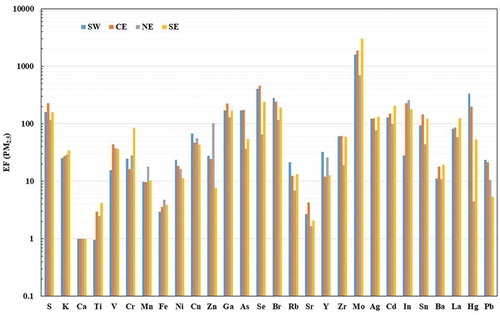
Figure 9. Enrichment factor value for PM2.5 using the concentration of the trace elements in the four sampling sites in the MMA, taking Ca as reference element.