Figures & data
Table 1. Characteristics of the houses monitored when biomass burning (BB) events were captured.
Figure 1. Hourly ambient PM2.5 concentrations during smoke plume events.
Figure 2. Frequency distributions of the 24-hr indoor PM2.5 concentrations (left) and hourly indoor PM2.5 concentrations (right) measured at the 21 residences. Outdoor sources are shown in blue, and indoor sources are shown in gray.
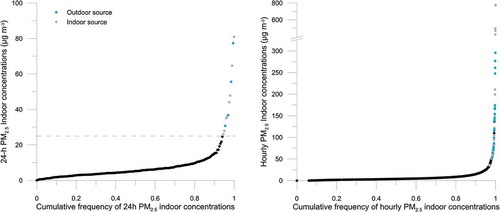
Table 2. Summary of outdoor and indoor PM2.5 measurements during smoke plume events.
Figure 3. Hourly outdoor and indoor PM2.5 concentrations and ventilation conditions during smoke plume events.
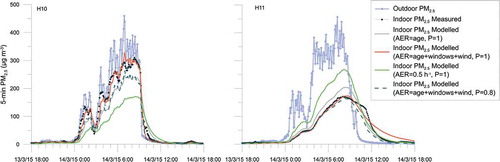
Figure 4. Time-series plots of 5-min PM2.5 concentrations measured indoors and outdoors at residence H10 (top) and residence H11 (bottom) during a smoke plume event in 2015.
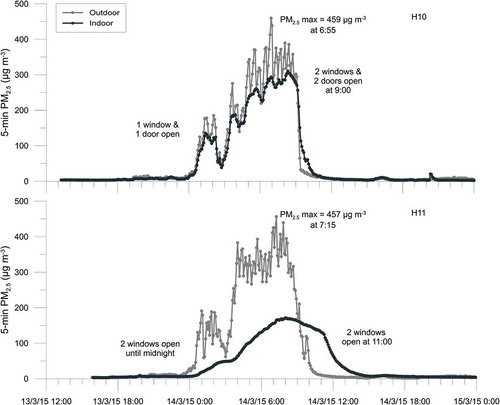
Figure 5. Measured and modeled PM2.5 concentrations during smoke plume events.