Figures & data
Table 1. Fuel-specific CO2 emission factors.
Table 2. Number of U.S. power plants and their CO2 emissions during 2013 reported by CAMD and EIA, by electric generation sector.
Figure 1. The CO2 emission tallies for U.S. power plants during 2013 reported by CAMD and EIA varied over multiple orders of magnitude. (a) The EIA data included many small plants with small emission tallies. (b) Most of the CO2 emissions were from large plants with large emission tallies.
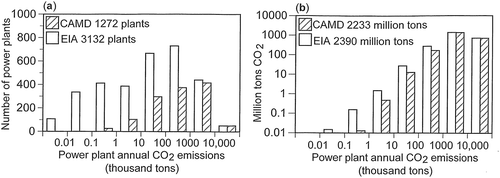
Table 3. Electric generation and CO2 emissions during 2013 for 1065 U.S. power plants by primary fuel.
Figure 2. The differences between the CO2 emission tallies reported by CAMD and EIA for 1065 power plants show a positive bias and a heavy-tailed (non-Gaussian) distribution. The figure includes U.S. power plants with CO2 emissions greater than 25,000 tons during 2013. The percent difference was calculated as 100 × (CAMD − EIA)/(CAMD + EIA)/2.
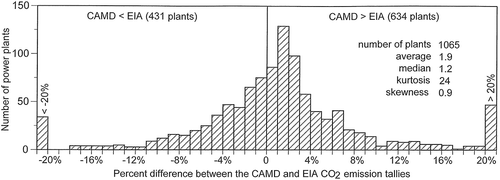
Figure 3. Distribution of differences between the CAMD and EIA CO2 emission tallies for (a) 118 plants where systematic error was identified but not corrected; (b) 947 plants remaining after exclusion of these plants; and (c) the remaining 947 plants where systematic error was corrected. Data are for 1065 U.S. power plants with CO2 emissions greater than 25,000 tons during 2013. The percent difference was calculated as 100 × (CAMD − EIA)/(CAMD + EIA)/2.
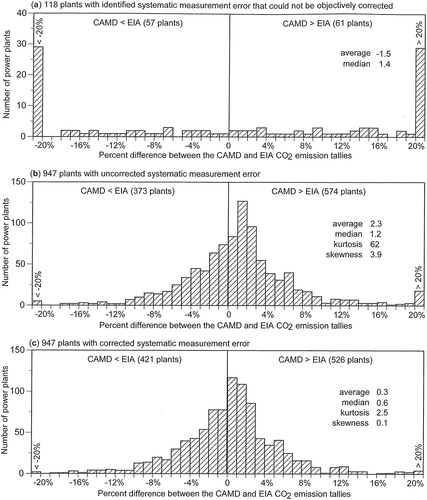
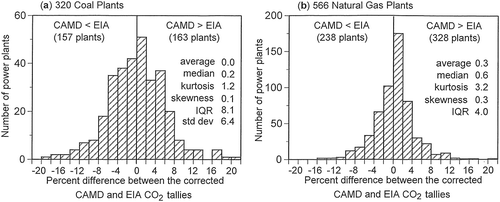
Figure 4. The differences between the CAMD and EIA CO2 emission tallies where systematic error was corrected show (a) a near-Gaussian distribution for the coal plants and (b) a non-Gaussian distribution for the natural gas plants. Year 2013 data, where kurtosis is the excess kurtosis, std dev is the standard deviation, IQR is the interquartile range, and the percent difference was calculated as 100 × (CAMD − EIA)/(CAMD + EIA)/2.