Figures & data
Figure 1. Schematic of the laboratory-scale biotrickling filter. (1) Air pump. (2) Air-mixing chamber. (3) Air rotameter. (4) Impinger for xylene. (5) Air inlet port. (6) Biotrickling filter. (7) Polyurethane packing. (8) Air outlet port. (9) Nutrient medium peristaltic pump. (10) NaOH solution. (11) Lye peristaltic pump. (12) pH online monitor. (13) Nutrient medium. (14) Magnetic stirrer. (15) Support table.
Figure 2. Time-dependent xylene concentration and removal with operating time.
Figure 3. Production of carbon dioxide as a function of elimination capacity.
Figure 4. Determination of Michaelis-Menten kinetic constants for xylene degradation.
Figure 5. Principal coordinate analysis (PCoA) of weighted UniFrac distances of the bacterial communities in different samples. T: top samples; M: middle samples; B: bottom samples.
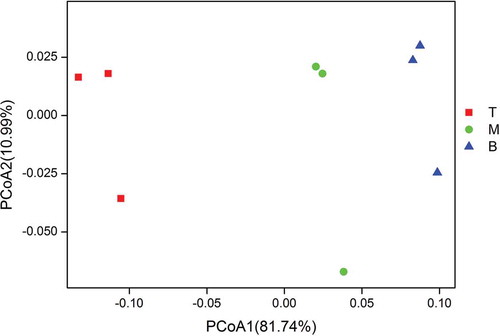
Figure 6. Abundances of different bacterial genera in the samples. The abundance is presented in terms of percentage among the total effective bacterial sequences in each sample. The top 10 abound taxa are shown.
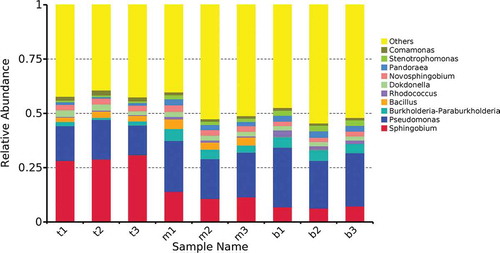
Table 1. Statistically significant differences in genera of the top 10 relative abundance levels in different samples.
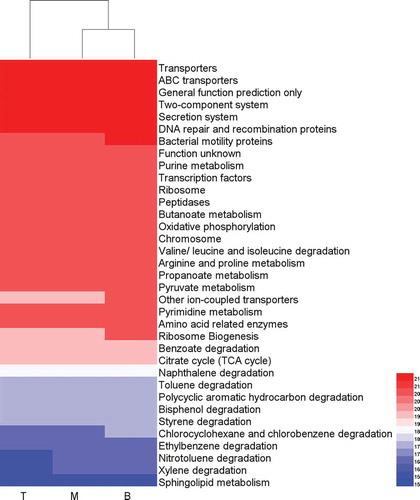
Figure 7. Heatmap of functional community profiles. T: top samples; M: middle samples; B: bottom samples.