Figures & data
Figure 1. (a) Map of India. (b) Map of Tamil Nadu. (c) Map showing the study area at Gummidipoondi. (d) Aerial view of monitoring location. Image sources: Maps of India (a, b); Image Source: Google Earth Pro (c, d).
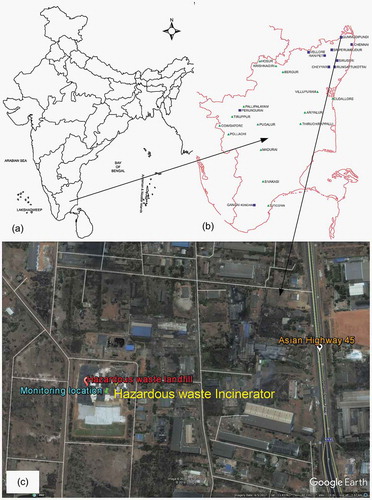
Table 1. Statistical summary of the attributes monitored during the study period.
Table 2. Comparison of O3 concentrations at different locations of India.
Figure 2. Time-series plot of hourly average O3 concentrations.
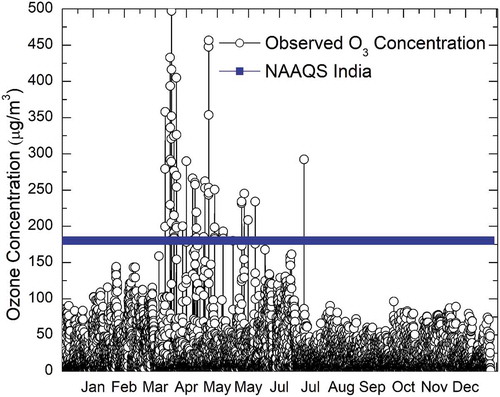
Figure 3. Monthly variation of ground level O3 concentration during the study period.
Figure 4. Monthly variation of the daily 1-hr maximum, mean daytime (11 hr from 7:00 a.m. to 6:00 p.m.), and daily (24-hr) concentrations of O3.
Figure 5. Diurnal variation of NO, NO2, and O3.
Figure 6. Wind rose plots during different seasons.
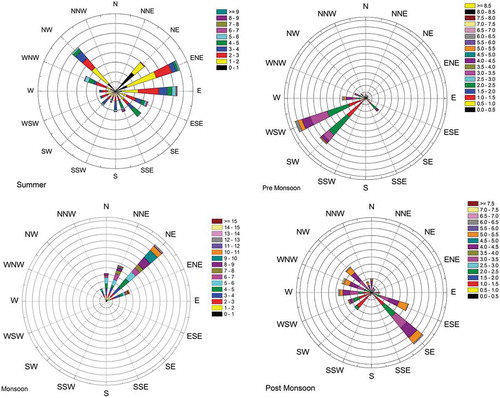
Figure 7. Peculiar pattern of wind speed and wind direction.
Figure 8. Scattered polar plot showing O3 concentrations greater than 40 μg/m3 (circles represent the observed O3 concentration).
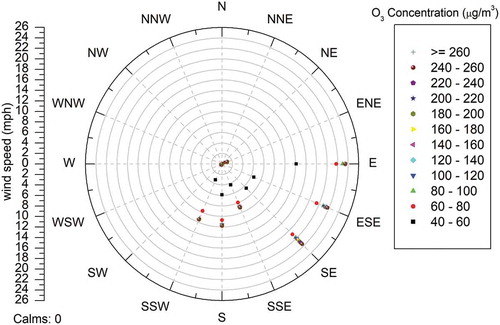
Table 3. Pearson’s correlation analysis of O3 with temperature, solar irradiance, relative humidity, and NOx during summer season (March, April, and May).
Table 4. Pearson’s correlation analysis of O3 with temperature, solar irradiance, relative humidity, and NOx during pre-monsoon season (June, July, August, and September).
Table 5. Pearson’s correlation analysis of O3 with temperature, solar irradiance, relative humidity, and NOx during monsoon season (October, November, and December).
Table 6. Pearson’s correlation analysis of O3 with temperature, solar irradiance, relative humidity, and NOx during post-monsoon season (January and February).
Figure 9. Regression analysis. (a) O3 with solar irradiance. (b) O3 with temperature. (c) Negative correlation of O3 with RH. (d) Positive correlation of O3 with RH. (e) O3 and NOx during the summer months. (f) O3 and NOx during the monsoon months. (g) Plot showing background ozone.
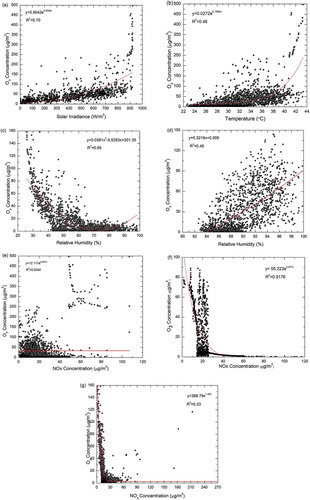
Figure 10. Monthly plots of 7-day isentropic backward-trajectory analysis using HYSPLIT4 trajectory model.
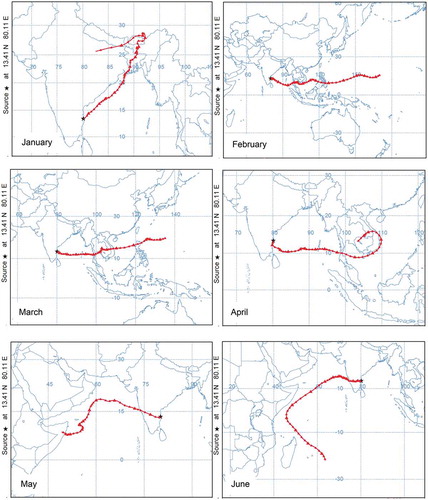
Figure 10. (Continued)
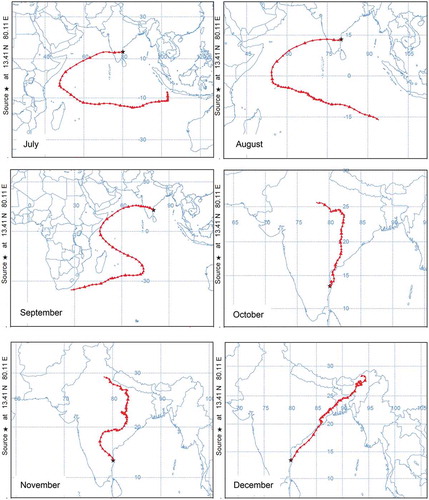
Figure 11. Monthly plot (Jan–Dec) of carbon monoxide at 900 hPa obtained from MOPITT.
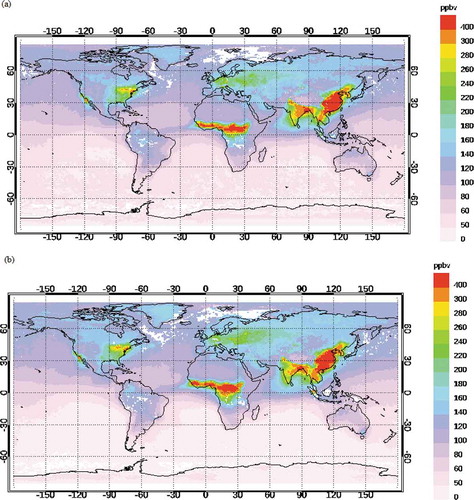
Figure 11. (Continued)
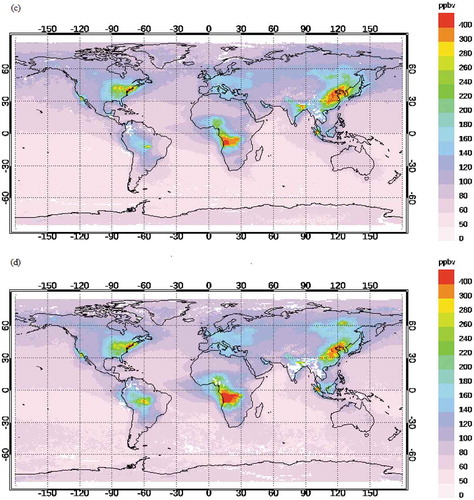
Figure 12. Diurnal variation of O3 and NOx during weekend and weekday.
Figure 13. Differences in weekend and weekday O3 and NOx concentrations