Figures & data
Figure 1. August 1990 Cover of the Journal of the Air & Waste Management Association showing the 1989 FEAT 1 setup on the northbound I-710 off-ramp to westbound Imperial Highway (left) and the same location used in 2018 with the current FEAT instrument setup for measurements (right).
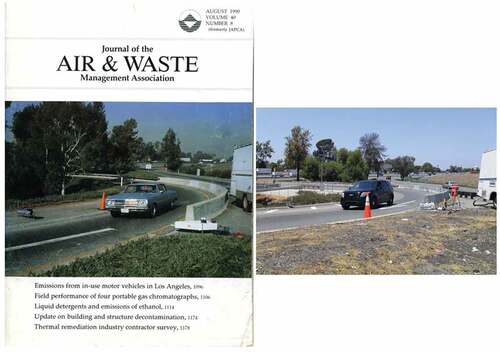
Table 1. Mean emission comparisons by site for the 1989, 1991, and 2018 Lynwood, CA, measurements.
Figure 2. Fleet percentage vs.vehicle age in years for the 1989 Long Beach Blvd. (filled bars) and 2018 Long Beach Blvd./I-105 (open bars) measurements. The 25-year-old category includes 25-year-old and older vehicles, and zero year vehicles are 1990 and 2018 models, respectively.
Figure 3. (a) Fuel specific CO and (b) HC (split y-axis) emissions by model year for the 1989, 1991 and 2018 Long Beach Blvd. measurements in Lynwood, CA. Uncertainties for the 1989 and 2018 measurements are the standard error of the mean calculated using the daily means.
Figure 4. (a) Normal probability plots comparing the fuel specific CO emission distributions for the 1989 (▲) and 2018 (●) I-710 off-ramp measurements and (b) the fuel specific HC emission distributions for the 1991 (▲) and 2018 (●) Long Beach Blvd. measurements (b). Open symbols are the respective means for each distribution.
Figure 5. Daily maximum 1-hr CO measurements collected at the South Coast AQMD Lynwood (●) and Compton (–) air quality monitoring stations. The Compton station replaced the Lynwood station beginning in 2009.
Figure 6. (a) Fuel specific CO, (b) HC and NO means for on-road measurements collected by the University of Denver in the Los Angeles basin by measurement year. Uncertainties are the standard error of the mean calculated from the daily means. The 2018 Lynwood measurement years have been offset a half-year for the Long Beach Blvd. (2017.3) and I-710 (2018.8) sites to improve visibility.
Figure 7. Fuel specific NH3 emissions by vehicle age in years for the Lynwood Long Beach Blvd./I-105 (●), I-710 off-ramp (○) and 2018 West Los Angeles (△) measurements. Uncertainties are the standard error of the mean calculated using the daily means.