Figures & data
Table 1. Description of field sampling locations.
Table 2A. Target VOCs: Health risk classifications and exposure levels.
Table 2B. Target Coeluting VOCs: Health risk classifications and exposure levels.
Figure 1. Observations of VOCs above the MDL with CV<20% and maximum concentration above 5 ppb (49 VOCs, 565 observations).
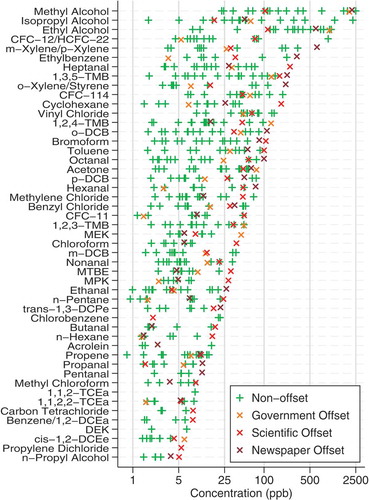
Table 3. Government Printery: VOC Concentrations (ppb).
Table 4. Scientific printery: VOC concentrations (ppb).
Table 5. Newspaper printery: VOC concentrations (ppb).
Table 6. VOC possible source summary.
Figure 2. Exposure to Ototoxic VOCs, relative to OELs, by sampling location.
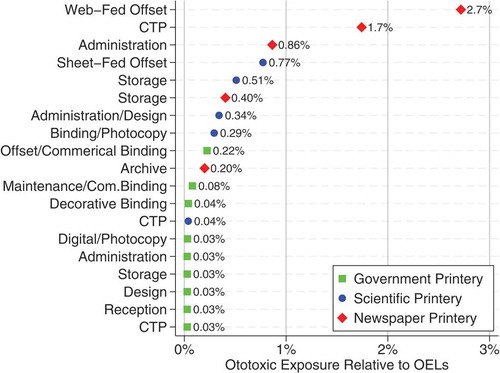
Figure 3. Exposure to Carcinogenic and probably Carcinogenic VOCs, relative to OELS, by sampling location.
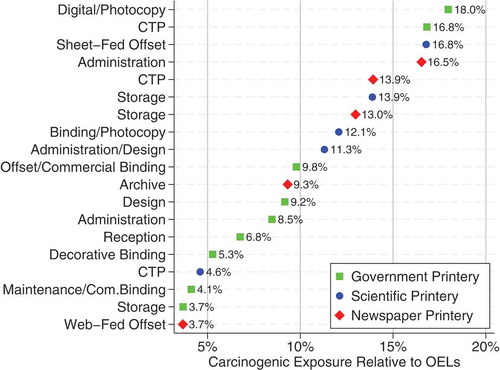
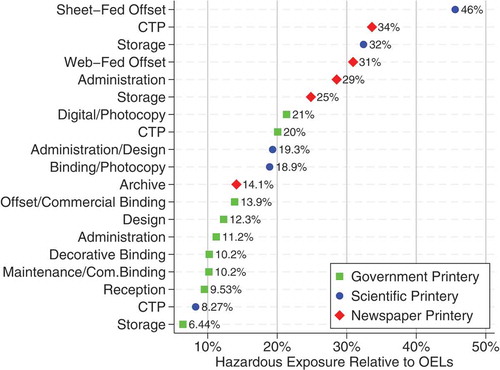
Figure 4. Exposure to Hazardous VOCs, relative to OELS, by sampling location.