Figures & data
Figure 1. TGA analysis of PM sample from T63 engine operated at cruise condition. Solid lines are under nitrogen environment; dashed lines under air environment.
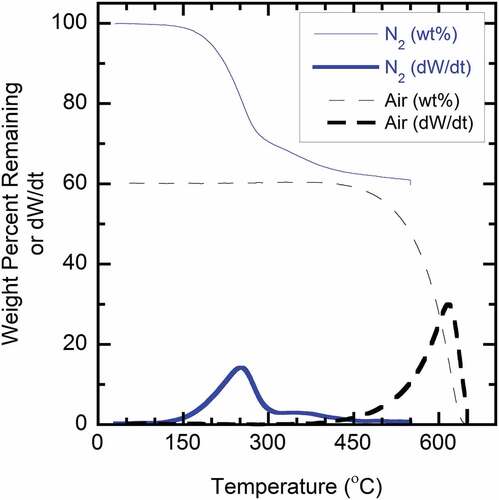
Figure 2. TGA profiles of turbine engine-borne PM samples and reference materials in an air environment; temperature profile of 30 − 1000°C at 20°C/min.
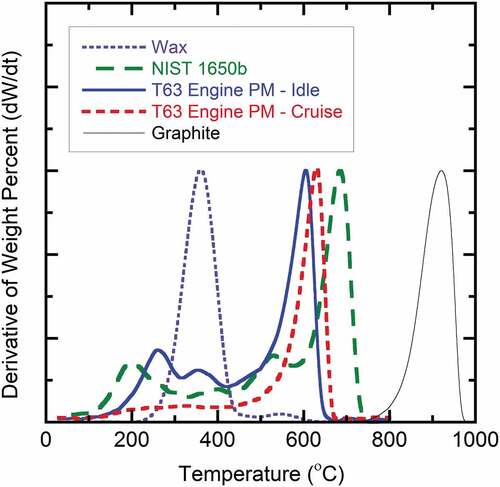
Figure 3. TOA profiles of PM samples from T63 engine and reference materials in a 100% oxygen environment; first-stage hold temperature of 400°C with temperature ramp of 105°C/min to 750°C.
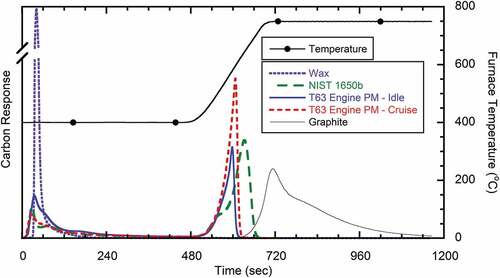
Table 1. EC fraction at varying first-stage TOA temperature and estimated from TGA.
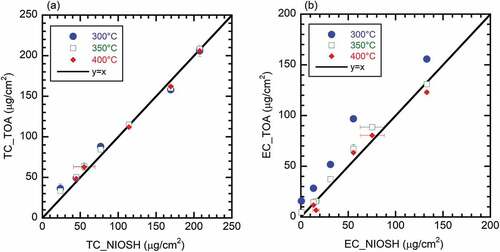
Figure 4. Parity plots of (a) total carbon, and (b) elemental carbon from turbine engine-borne PM samples (at various engine conditions and fuel types) with respect to initial temperature of TOA analysis; data points are averaged values, error bars represent one standard deviation.