
Figures & data
Table 1. 32 FFD matrix containing tested levels of the independent variables along with the values of responses used in this study (adapted from Chaiprapat et al. 2015).
Table 2. Sequential model sum of squares for H2S removal efficiency in SBTF and TBTF.
Table 3. Model summary statistics for H2S removal efficiency in SBTF and TBTF.
Table 4. ANOVA analysis for the quadratic model of H2S removal efficiency in SBTF and TBTF.
Figure 1. Comparison between predicted and experimental (actual) values for the responses (a) H2S removal efficiency in SBTF (Y1) and (b) H2S removal efficiency in TBTF (Y2).
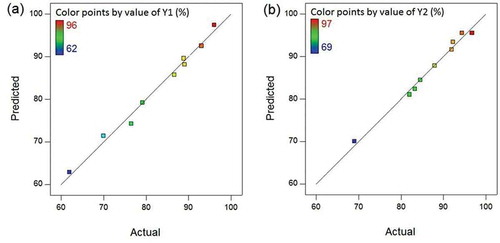
Figure 2. Normal probability plot of residuals for the responses (a) H2S removal efficiency in SBTF (Y1) and (b) H2S removal efficiency in TBTF (Y2).
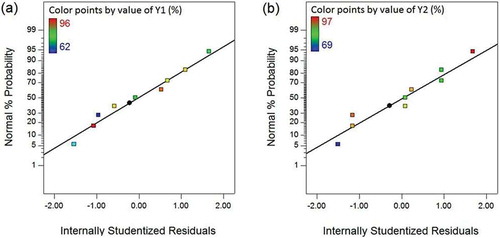
Figure 3. Internally studentized residuals versus predicted values of responses (Y1: H2S removal efficiency in SBTF; Y2: H2S removal efficiency in TBTF).
Figure 4. (a) 3D response surface and (b) 2D contour plots illustrating the effect of EBRT and LRV on H2S removal efficiency in SBTF (Y1).
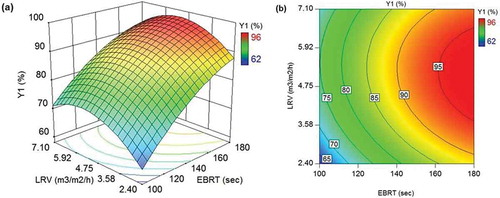
Figure 5. (a) 3D response surface and (b) 2D contour plots illustrating the effect of EBRT and LRV on H2S removal efficiency in TBTF (Y2).
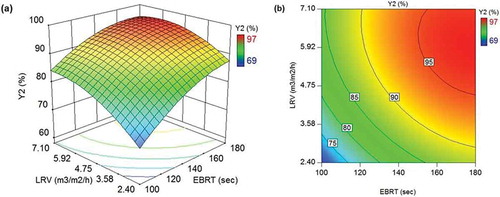
Table 5. Effect of EBRT and LRV on H2S removal efficiency in SBTF and TBTF (data from and ).