Figures & data
Figure 1. Schematic diagram of the tubular furnace.
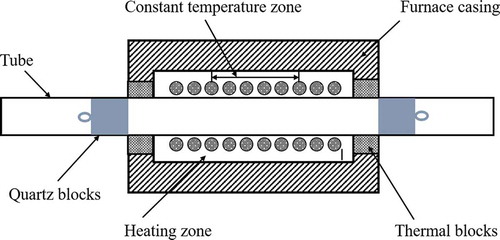
Figure 2. Flow chart of the thermal shock treatment.
Table 1. Factors and levels of orthogonal experiments.
Figure 3. Schematic diagram of the peel tester.
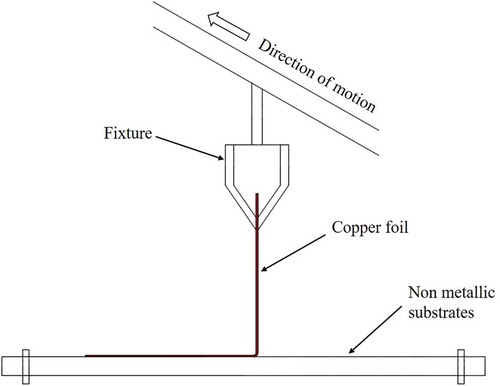
Figure 4. Cross-sectional macro-structural schematic of the SSCCL.
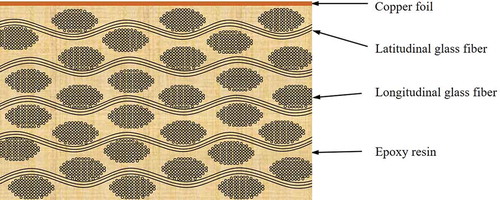
Table 2. Pyrolysis of scrap PCBs analyzed by a number of publications.
Figure 5. TGA curves of the SSCCL.
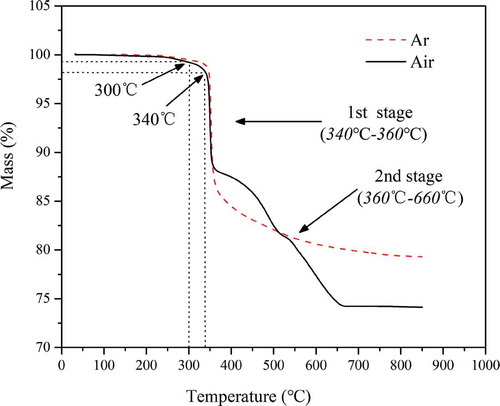
Table 3. The factional factorial experiments.
Figure 6. Peel strength trend under different shock conditions.
Figure 7. The effect of peak temperature, holding time, and shock cycles on peeling strength.
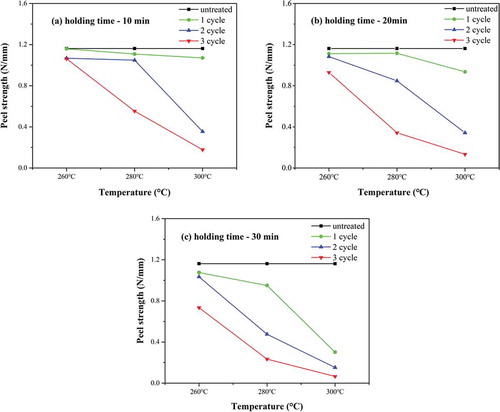
Figure 8. Microstructure of the interface of metals and nonmetals for SSCCLs before and after thermal shock: (a) untreated SSCCLs, (b) treated SSCCLs, (c–e) enlarged drawings corresponding to area I, II, and III in (b), respectively.
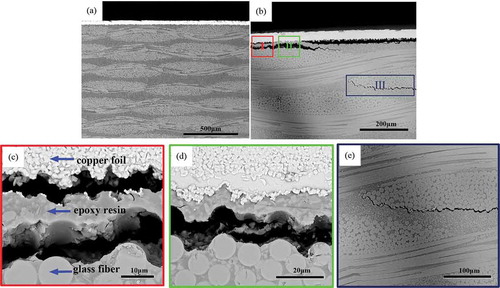
Figure 9. Manual peeling verification procedure under the optimal thermal shock condition.
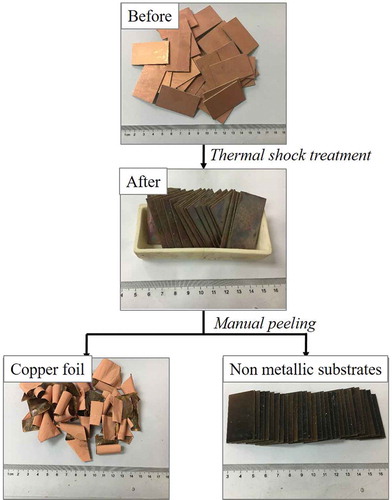
Figure 10. Copper foil surface after manual peeling.