
Figures & data
Figure 1. Schematic of manure drying system.
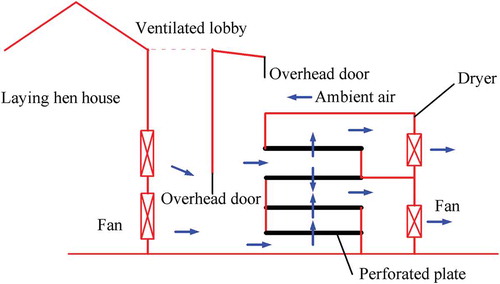
Table 1. Properties of raw manure samples.
Figure 2. Experimental dryer unit. 1. fan for force convection; 2. humidifier; 3. electric heater; 4. Humidity & Temperature Sensor and proportional controller; 5. manure sample on perforated trays.
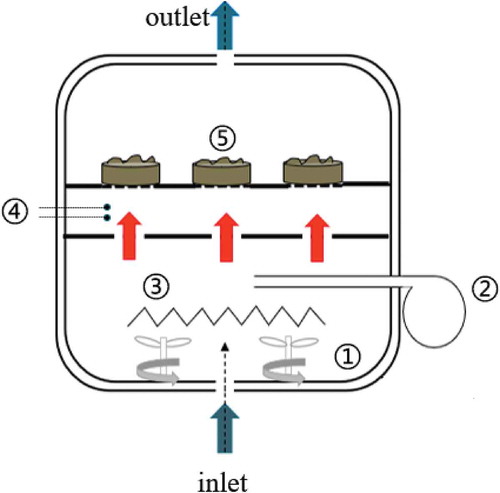
Table 2. Levels of experimental factors and coded values.
Table 3. Uncertainties of the parameters during drying of manure.
Table 4. Central composite rotatable design for three factors and results of responses values.
Figure 3. (a) Drying curves at different hot air temperature with the manure layer thickness of 100 mm and the air velocity of 1.2 m/s. (b) Drying curves at different air velocity with the manure layer thickness of 100 mm and the hot air temperature of 25°C. (c) Drying curves at different manure layer thickness with the hot air temperature of 25°C and the air velocity of 1.2 m/s.
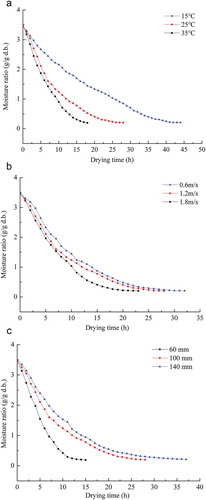
Table 5. ANOVA for the regression response surface model.
Figure 4. The effects of (a) hot air temperature and air velocity, (b) hot air temperature and manure layer thickness, (c) manure layer thickness and air velocity on response surface plots of fan’s energy consumption.
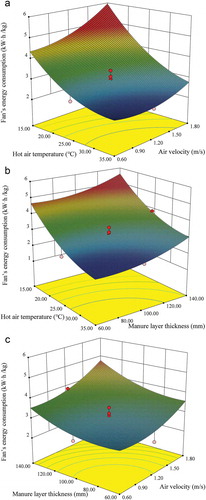
Figure 5. The effects of (a) hot air temperature and air velocity, (b) hot air temperature and manure layer thickness, (c) manure layer thickness and air velocity on response surface plots on dehydration rate.
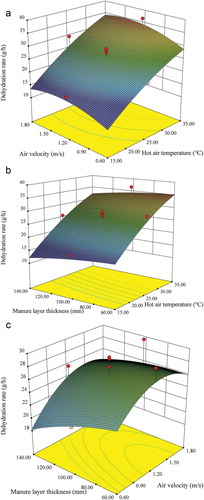
Figure 6. The effects of (a) hot air temperature and air velocity, (b) hot air temperature and manure layer thickness, (c) manure layer thickness and air velocity on response surface plots on nitrogen loss rate.
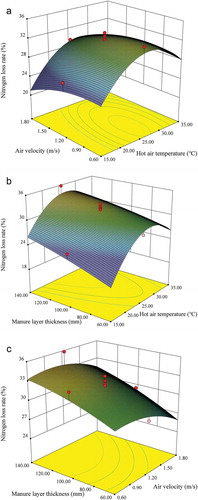
Table 6. Validation results of optimization scheme.