Figures & data
Figure 1. The locations for PM concentration monitoring and PSD sampling: (a) Schematic layout of the measured laying hen house with LCAU; and (b) Vertical plan of the LCAU.
Figure 2. Classification of the PM composition based on hierarchical cluster analysis in the days with different atmospheric air quality. Date with green background – Excellent air quality (AQI: 0– 50); Yellow – Good (AQI: 50– 100); Orange – Lightly polluted (AQI: 100– 150); Red – Moderately polluted (AQI: 150– 200).
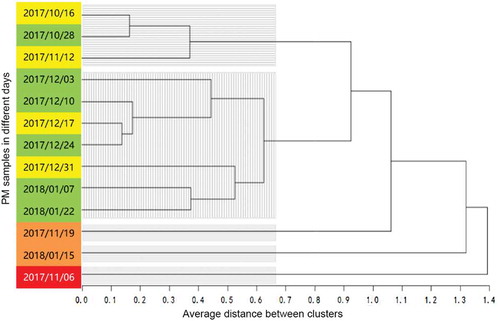
Table 1. Overall average PM concentrations in varied production systems, expressed in mean ± SD (mg/m3).
Figure 3. Variation of TSP concentration inside the laying hen house with LCAU in December, 2017. To = Temperature outside the laying hen house; Ti = Temperature inside the laying hen house.
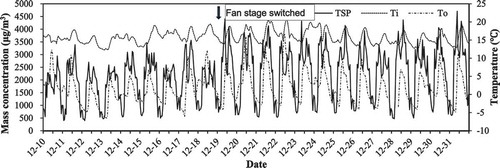
Figure 4. Mass distribution at the air inlet (East) end of laying hen house.
Figure 5. Mass distribution at the air outlet (West) end of laying hen house.
Figure 6. Positional average PM MMDs and MGSDs with standard deviations.
Figure 7. Distribution of different sized PM in mass measured by Anderson 8-stage non-viable sampler from October to December. To = Temperature outside the laying hen house; Ti = Temperature inside the laying hen house.
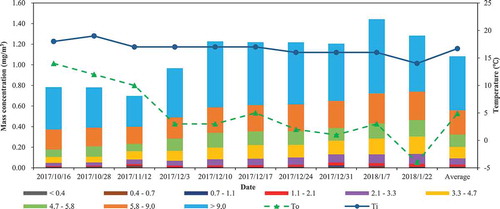
Figure 8. Count distribution at the inlet end of laying hen house.
Figure 9. Count distribution at the outlet end of laying hen house.
Figure 10. Positional average PM CMDs and CGSDs with standard deviations.
Figure 11. Mass cumulative distribution at the inlet end of laying hen house.
Figure 12. Mass cumulative distribution at the outlet end of laying hen house.
Figure 13. Count cumulative distribution at the inlet end of laying hen house.
Figure 14. Count cumulative distribution at the outlet end of laying hen house.