Figures & data
Figure 1. FTIR spectra of extracted CS from C. multicarinata shells
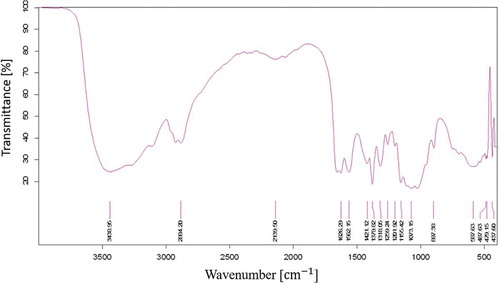
Figure 2. Morphological characterization of Squilla derived CS showing A. Scanning electron microscopy image, B. Energy dispersive spectroscopy analysis, C. X-Ray diffraction analysis
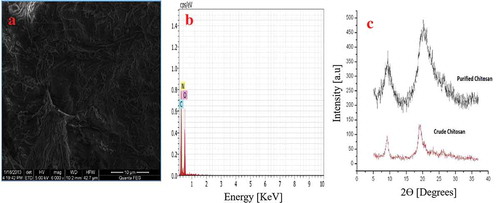
Figure 3. (a) FTIR spectra of Blank CSNP, Drug (DP), DP-CSNPs and (b) X-Ray diffraction graph for A. Blank CSNPs, B. Drug (DP) and C. DP-CSNP
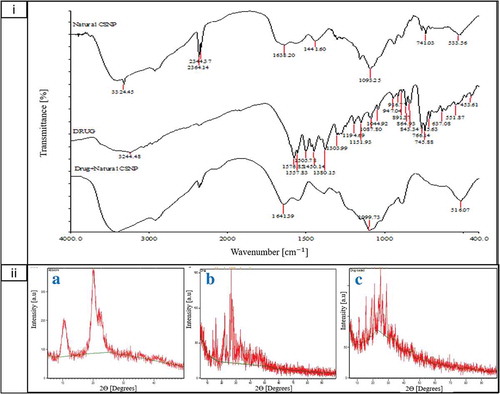
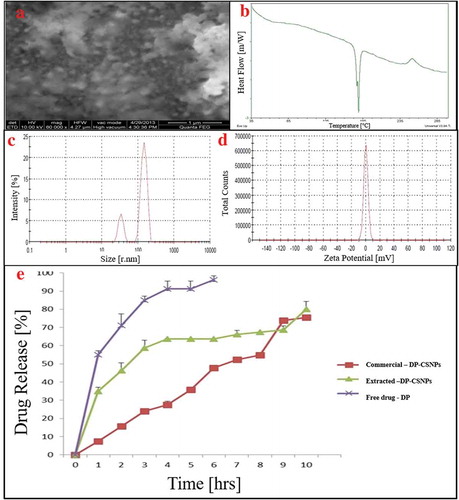
Figure 4. Material characterization of extracted CS derived DP-CSNPs showing A. Scanning electron micrograph image, B. Differential scanning calorimetry thermogram, C. Particle size distribution D. Zeta potential and E. In vitro drug release profile at pH 7.4 for commercial CS synthesized DP-CSNPs, squilla CS synthesized DP-CSNPs and free drug