
Figures & data
Table 1. Hand-generated configuration of the 18 sources created to test the optimization-based methane emission estimation approach.
Figure 1. Source and receptor positions for the hand-generated SEM.
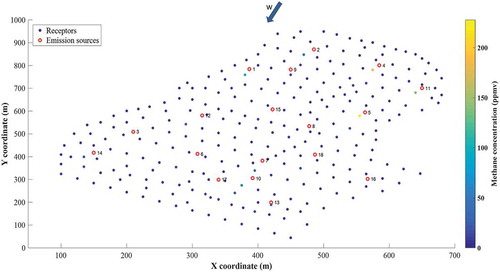
Figure 2. Source and receptor positions for the hand-generated drone emission monitoring (DEM).
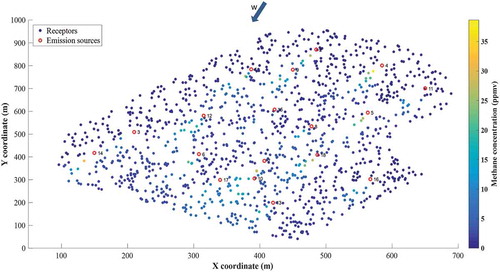
Figure 3. Source and receptor positions for the hand-generated downwind plume monitoring (DWPEM). The figure shows the limits of the studied landfill and the model-predicted methane concentrations for the receptors.
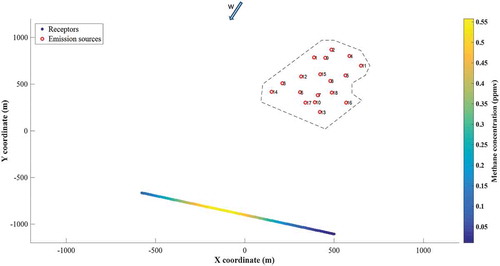
Figure 4. Field study SEM measurements performed in the two-days sampling campaign with their corresponding methane concentrations in ppmv. Red circular markers indicate the position of the emission sources predicted using the GA-based method.
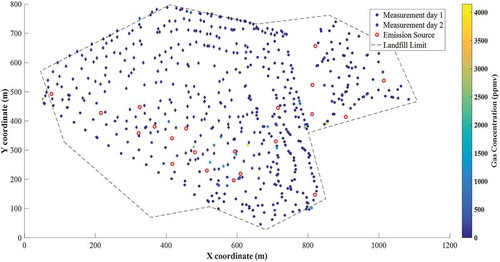
Figure 5. Field study DEM measurements performed in day 1 of the sampling campaign with their corresponding methane concentrations in ppmv. Red circular markers indicate the position of the emission sources predicted using the GA-based method.
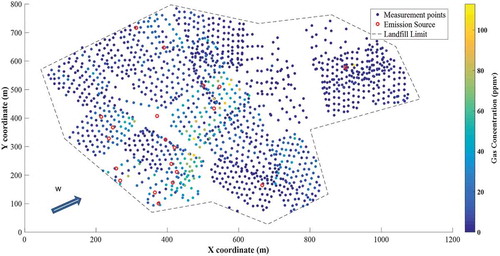
Table 2. Meteorological parameter values for the field campaign.
Table 3. Whole-site methane emission predictions for varying number of estimated sources using SEM and DEM for the hand-generated case-study. The estimation error is displayed for each case.
Figure 6. Predicted source positions using the DEM dataset compared with the predefined source locations in the hand-generated case study. Results obtained using the SEM dataset are also displayed.
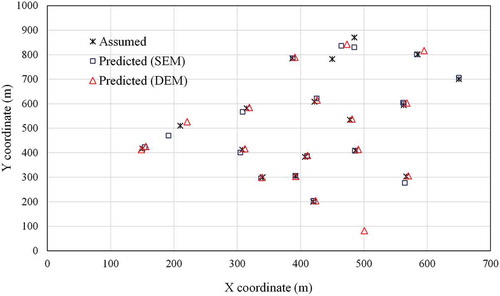
Figure 7. Predicted source emission rates using the SEM and the DEM datasets compared with the predefined emission rates in the hand-generated case study.
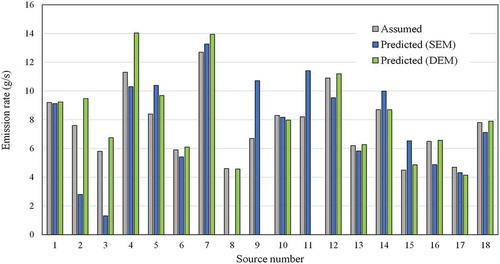
Table 4. Emission estimates and prediction errors using DEM dataset with variable stability class, wind direction and speed. The reference values are indicated in bold for each case.
Table 5. Whole site emission predictions using DEM with variable wind speed ranging between 1.18 m/s and 4.18 m/s. Emission estimates are displayed for the minimum, the average and the maximum wind speed values.
Table 6. SEM and DEM based estimated methane emission sources for the field study.
Table 7. Total estimated emissions based on DWPEM for the field study. The wind direction for each plume is indicated. Results of the optimization-based method are compared with the results obtained using the method proposed by (Fredenslund et al. Citation2018).