
Figures & data
Table 1. Characteristics of corn stover, dairy manure and inoculum used in this study.
Table 2. Co-digestion substrate mix proportion based on total solids.
Figure 1. Process flowchart and the SEM image surface profile analysis strategy. (a) Overall flowchart of the developed ImageJ plugin showing sequence of image processing operations for profile classification of the corn stover particle sizes, (b) demonstration of the surface profile analysis on a portion of SEM image showing 10 rectangular sub-ROIs used for profile values extraction, and (c) illustration of grayscale profile generation for one sub-ROI by averaging gray pixels along hsROI vertically and proceeding along LsROI horizontally.
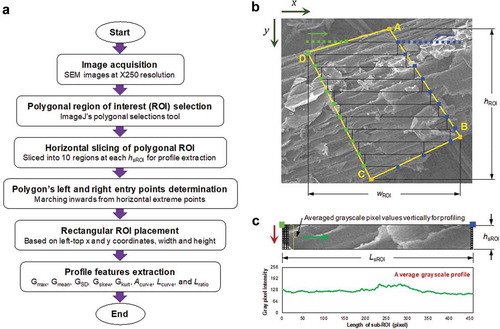
Figure 2. Sample SEM images of ground corn stover at two particle sizes (0.14–0.42 mm and 0.42–0.84 mm) showing the selected replication regions along with their surface profile from sub-ROIs. The black rectangles in Rep #2 represent the sub-ROIs used for generating the respective profile given below the SEM image.
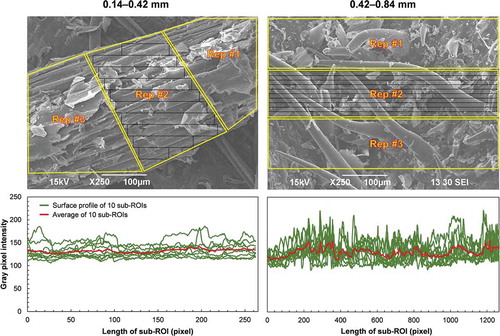
Table 3. Details of the kinetic models used in this study.
Table 4. Characteristics of pre- and post-digestion samples under different treatments.
Figure 3. VFA concentration of the treatments at the pre- and post-digestion stage (error bar = 1 std. dev).
Table 5. Process parameter for each treatment used in this study.
Figure 4. Cellulose, hemicellulose, and substrate biodegradability under different treatments (error bar = 1 std. dev).
Figure 5. Total and volatile solids reduction under different treatments (TS, VS; error bar = 1 std. dev).
Figure 6. Methane composition over time for different treatments.

Figure 7. Hydrogen sulfide concentration trends under different treatments.
Figure 8. Overall biogas and methane yield for different treatments.
Figure 9. Volumetric methane production and total methane energy for treatments with a C/N ratio of 24(error bar = 1 std. dev).
Figure 10. Mean and standard deviation values of the profile features from 10 sub-ROIs of each replication (based on polygonal ROI) from the milled corn stover SEM images discriminating the particle sizes.
Figure 11. Cumulative methane production with different treatments over the time studied.
Table 6. Kinetic model and validation for treatment with C/N ratio of 24.