Figures & data
Table 1. Physicochemical properties of the raw sludge (RS) and sewage sludge derived biochar (SSB).
Table 2. The characteristics of the inoculum, substrates in the batch experiment.
Figure 1. The change of (a) cumulative methane yield; (b) pH, (c) VFAs in C-SSB, and (d) VFAs in C-control.
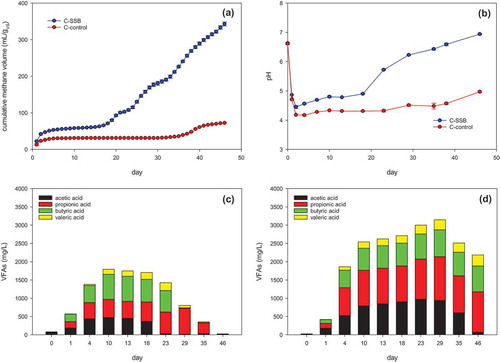
Figure 2. The comparison of (a) bacteria at the phylum level and (b) archaea at the genus level among the inoculum, C-SSB, and C-control in the early (e), and final (f) stages.
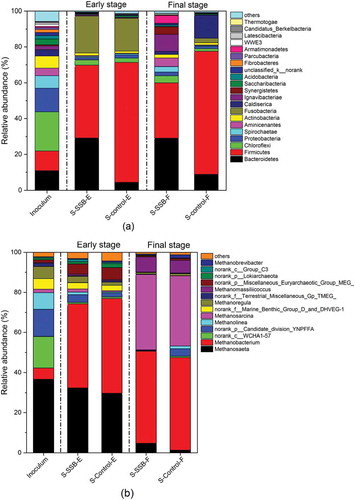
Figure 3. The change of (a) cumulative methane yield, (b) pH, (c) VFAs in P-SSB, and (d) VFAs in P-control.
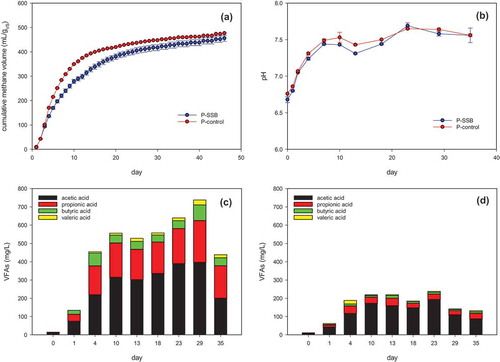
Figure 4. (a) Methane generation rate and (b) ammonia-nitrogen concentration in P-SSB and P-control.
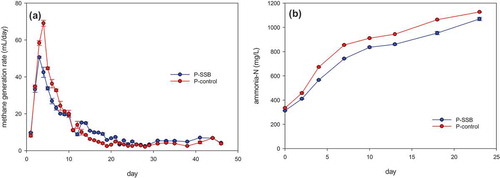
Figure 5. The comparison of (a) bacteria at the phylum level and (b) archaea at the genus level among the inoculum, P-SSB, and P-control in the early (e), and final (f) stages.
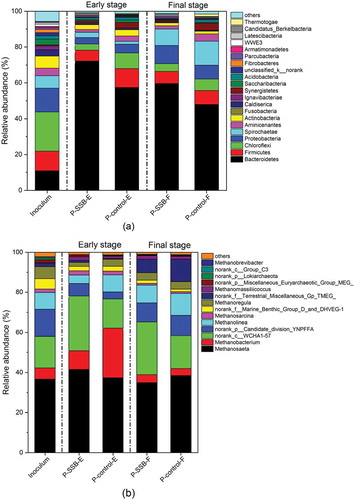
Figure 6. The change of (a) cumulative methane yield, (b) pH; (c) VFAs in L-SSB, and (d) VFAs in L-control.
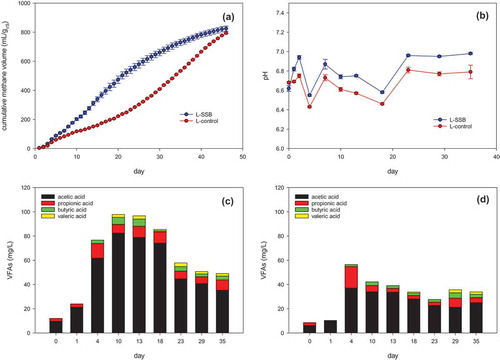
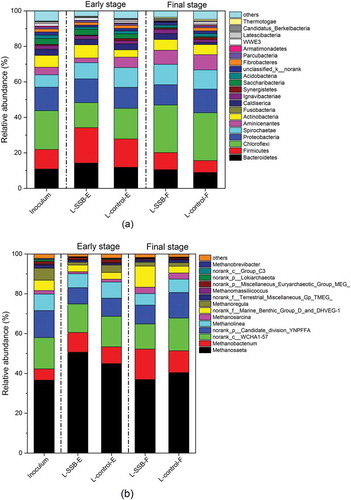
Figure 7. The comparison of (a) bacteria at the phylum level and (b) archaea at the genus level among the inoculum, L-SSB, and L-control in the early (e), and final (f) stages.