Figures & data
Figure 1. Monitoring site locations for Campaigns I and II (left) and Campaign III (right)
Table 1. Site locations and measurements deployed in Campaigns I and II
Table 2. Site locations and measurements deployed in Campaign III
Table 3. Summary average BC concentrations for Campaigns I and II, segregated by wind direction
Table 4. Summary average BC concentrations for Campaign III, segregated by wind direction
Figure 2. Campaign I and II gradients in hourly average binned BC concentrations (ng/m3) measured by microAeths when winds are from the north (top), parallel (middle), and south (bottom)
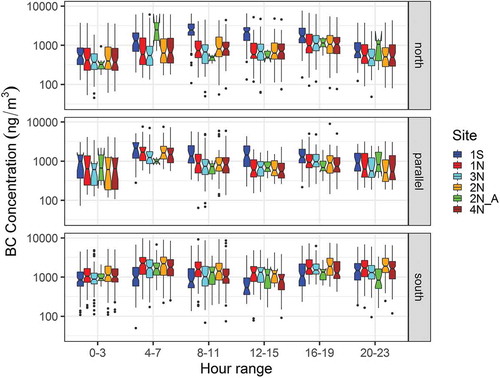
Figure 3. Campaign III gradients in hourly average binned BC concentrations (ng/m3) measured by microAeths when winds are from the north (top), parallel (middle), and south (bottom)
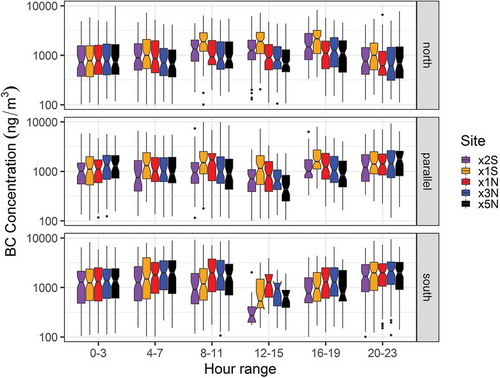
Figure 4. Enrichment ratio scatter plots of (top, left) benzene and n-pentane divided by propane, (top, right) benzene and 2,2,4-trimethylpentane divided by propane, and (bottom, left) benzene and i-butane divided by propane. All figures are colored by wind direction bins, and sites are indicated by different shapes
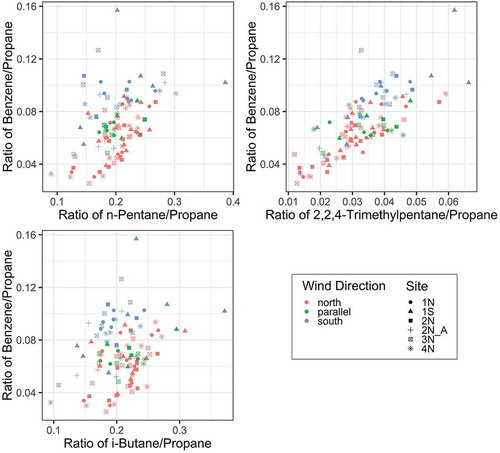
Table 5. Factors identified and key pollutants used to classify emissions sources in PMF
Figure 5. Percent of pollutants identified in each factor with a 3-factor PMF solution excluding isoprene
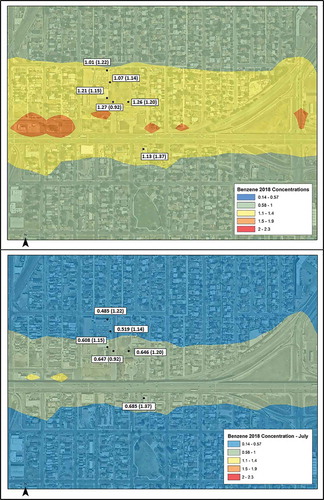
Figure 6. Predicted 24-hour averages of benzene concentrations during the month of January 2018 (top) or July 2018 (bottom) and the observed benzene measurements (24-hour averages) collected from September 15 through October 28, 2018. The values on the map are shown as: Model (Monitor)