
Figures & data
Daniel A. Jaffe

Figure 1. (A) (top) Observed smoke on September 4, 2017. (Top) NASA Worldview (https://worldview.earthdata.nasa.gov/) image showing fire hotspot detections from the VIIRS and MODIS satellite instruments, along with visible satellite imagery from the VIIRS instrument between 1200–1400 local time. Bright white areas are clouds; grayer areas are smoke. (B) (Bottom) 24-hour average PM2.5, shown as the corresponding Air Quality Index (AQI) level category colors, based on surface PM sensors collected in the EPA’s AirNow system (https://www.airnow.gov/).
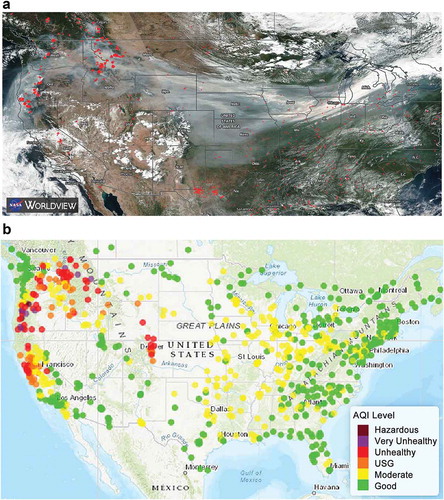
Figure 2. Progression of fires throughout the year using 2017 MODIS hotspot fire detections.
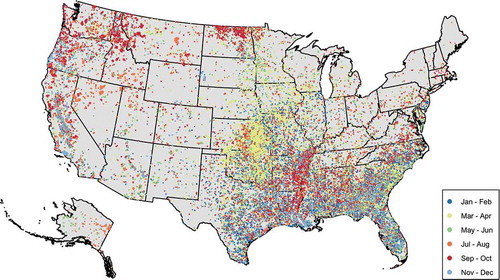
Figure 3. Total U.S. wildfire area burned (ha) and federal suppression costs for 1985–2018 scaled to constant (2016) U.S. dollars. Trends for both wildfire area burned and suppression indicate about a four-fold increase over a 30-year period.
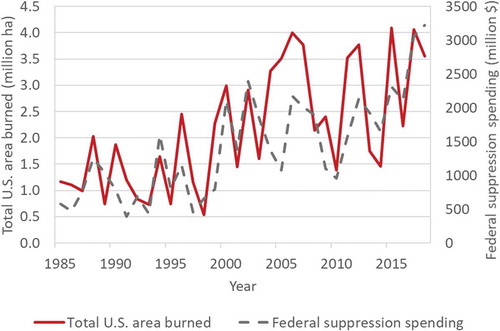
Figure 4. Satellite detections of the Kincade fire in northern California on October 27, 2019 by Geostationary Orbiting Environmental Satellite (GOES) and the polar-orbiting Visible Infrared Imaging Radiometer Suite (VIIRS). Hotspot detections by each are shown at the center points of the sensor pixels (yellow squares: GOES-16; red circles: VIIRS). Black outline: final fire perimeter. The VIIRS detections provide a higher resolution detection (~375 m), but only during overpasses. The geostationary GOES-16 provides a continuous observation but at a lower resolution (~2 km). The size of squares and circles is illustrative and not related to hotspot detection strength or size. Data sources: GOES and VIIRS detections based on NOAA Hazard Mapping System–collected detections; perimeter based on GeoMac data. Image source: U.S. Forest Service.
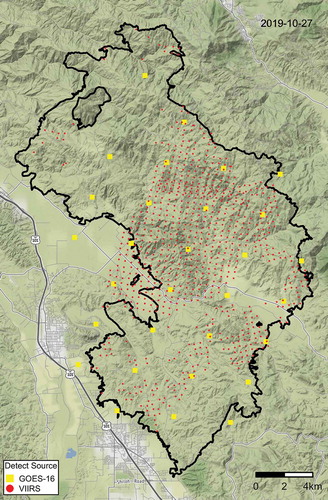
Figure 5. Camp wildfire, northern California, November 8, 2018. A NOAA HMS smoke plume at 12:30:00 PST. Colors are qualitative representation of smoke intensity (green: light, yellow: medium, red: heavy). (b) Visible satellite imagery from GOES-16 overlaid with surface measurements of 1-hr average PM2.5 concentrations at 13:02:00 PST. Colors for the PM2.5 data are associated with the AQI scale (see ). The right figure is from the NOAA Aerosol Watch program (https://www.star.nesdis.noaa.gov/smcd/spb/aq/AerosolWatch/).
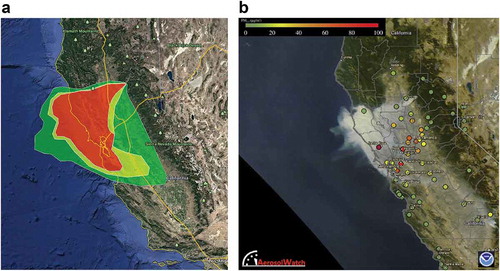
Table 1. Top five states for annual area burned as wildfires, from the EPA draft National emissions inventory for 2017. Also shown are the peak monthly areas burned (blue shading), peak monthly PM2.5 emitted (orange), and the maximum PM2.5 concentration measured at any regulatory monitor for the month (green; data from AirNowTech).
Table 2. Top five states for annual area burned as prescribed fires, from the EPA draft National Emissions Inventory for 2017. Also shown are the peak monthly areas burned (blue shading), peak monthly PM2.5 emitted (orange), and maximum PM2.5 concentration measured at any regulatory monitor for the month (green; data from AirNowTech).
Figure 6. (Top) Box and whisker plots of all daily PM2.5 concentrations by year for air quality monitors in California. The numbers at the top of the panel show the total number of monitor-days above the daily PM2.5 standard (35 µg/m3). Colored horizontal lines show the six AQI cut points: Good, <12 µg/m3; Moderate, <35.4 µg/m3; Unhealthy for Sensitive Groups, <55.4 µg/m3; Unhealthy, <150.4 µg/m3; Very unhealthy, <250.4 µg/m3; Hazardous, >250 µg/m3 (see for color key). (Bottom) Annual area burned (left y-axis) and percentage of all monitor-days that exceeded the daily PM2.5 standard (right y-axis). All PM2.5 data from the EPA AQS system are included (regulatory and non-regulatory). Sources: Burned area for each state is from NIFC, and PM2.5 data are from the EPA AQS database.
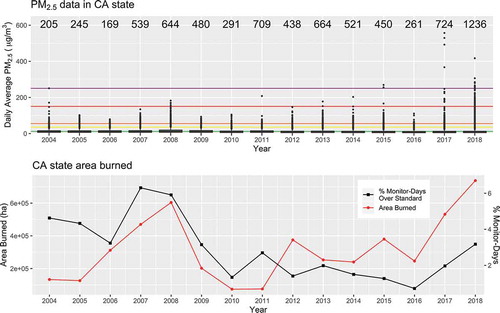
Figure 7. As in , but for Washington.
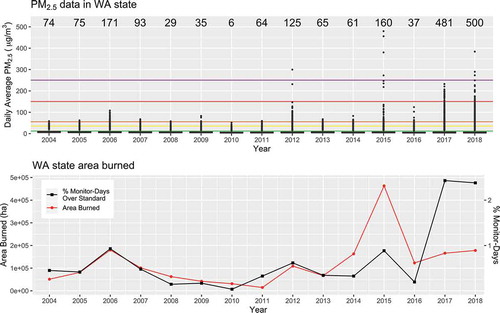
Figure 8. Comparison of the annual average hectares burned for each state in the continental U.S. (2006–2016) with the number of particulate matter emission factor observations for each state in the SERA database.
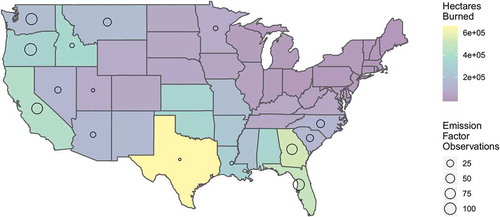
Table 3. Comparison of average emission factors (EFs) from non-biomass fuels (e.g., structures, furnishings, vehicles) at the wildland-urban interface (WUI) and from natural fuels from wildland fires, derived from SERA. EF units are g/kg fuel consumed, unless otherwise noted.
Table 4. Summary of wildland fire for different regions in the U.S.