Figures & data
Figure 1. Changes in the composition of gasoline over the period of ethanol introduction (EPA Citation2017). Aromatics reporting is addressed in 40 CFR Part 80.46 (f)(1) and (f)(3)
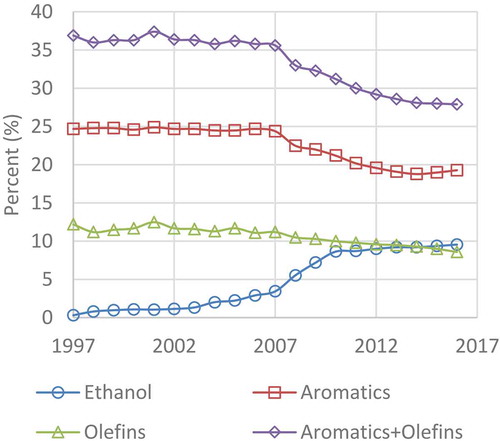
Figure 2. Distillation curves for E0, E10, E15, and E20 fuels, showing the ethanol blending effect on the distillation temperatures (API Citation2010)
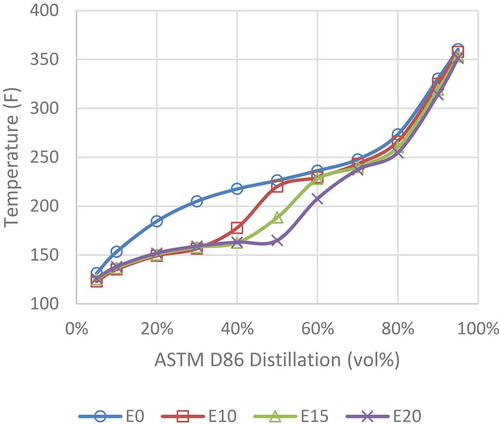
Figure 3. Measured and modeled emissions of the E0 and E10 fuels in the EPAct study for LA92 Phase 1 PM
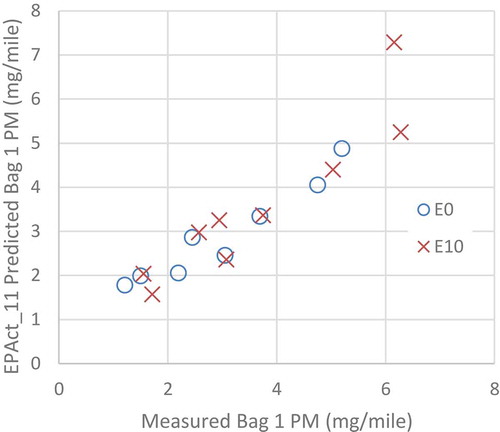
Figure 4. Comparison of measured and predicted LA92 Phase 1 ratios of emissions of all of the 27 EPAct fuels with one another
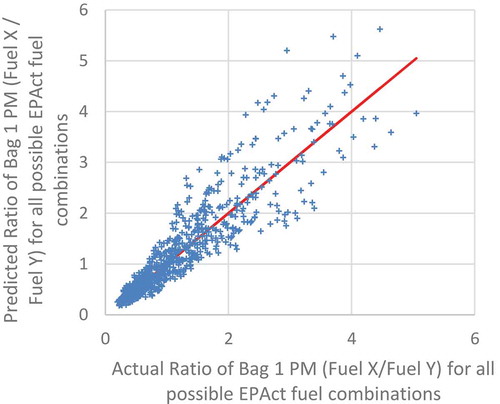
Figure 5. Distillation curves for E-94 fuel C (E0), re-blended E-129 fuel C (E0), and E-94 fuel C splash blended to E10. E-94
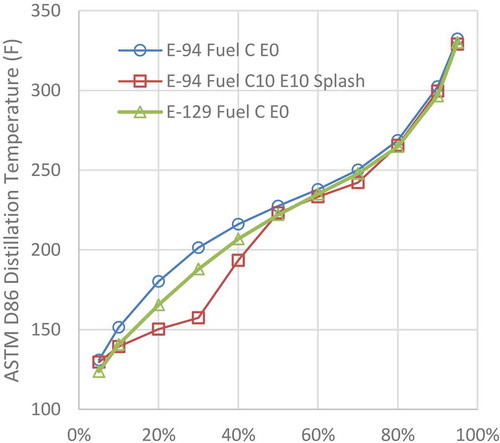
Figure 6. Relationships between aromatic and ethanol content for the EPAct and E-94 studies
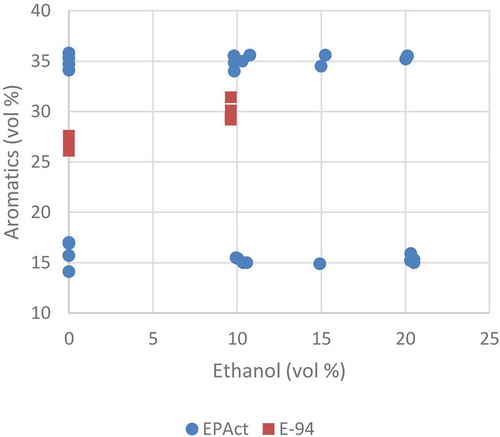
Figure 7. Relationships between PMI and ethanol content for the EPAct and E-94 studies
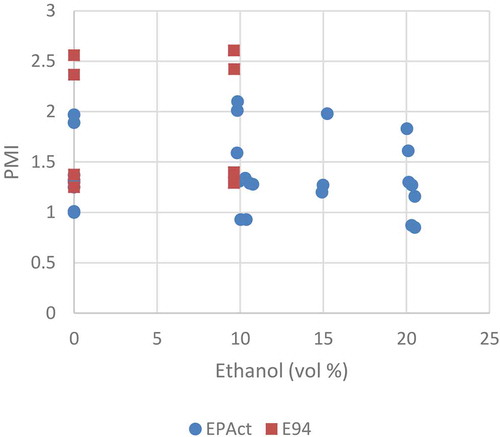
Figure 8. Relationship between PMI and aromatic content for the EPAct and E-94 studies
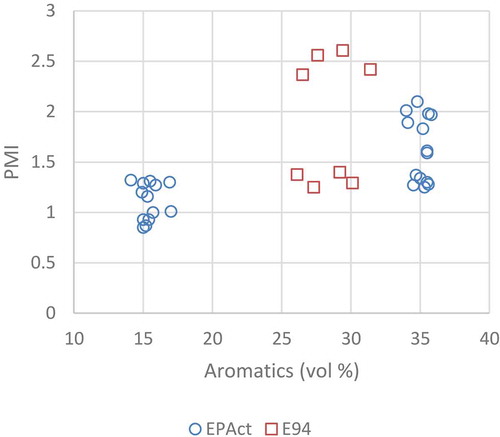
Figure 9. PMI and aromatic content separated by ethanol fraction for EPAct and E-94 fuels, and the fuels used by Yang et al. (Citation2019a, Citation2019b)
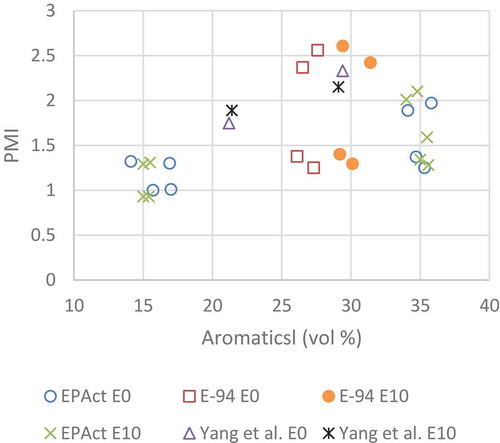
Figure 10. In a decade US refinery gasoline production changed from predominantly finished product to predominantly BOB
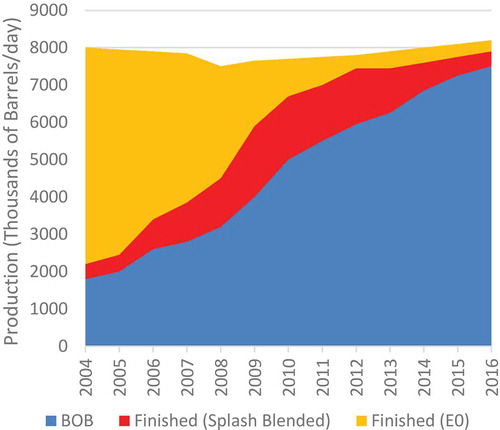
Table 1. Representative summer regular AKI blend properties based on available automobile alliance fuel data and EPA fuel quality trends
Table 2. Coefficients for five PM models based on the EPAct data
Figure 11. Fit of the 11 term EPAct model with the EPAct measurements
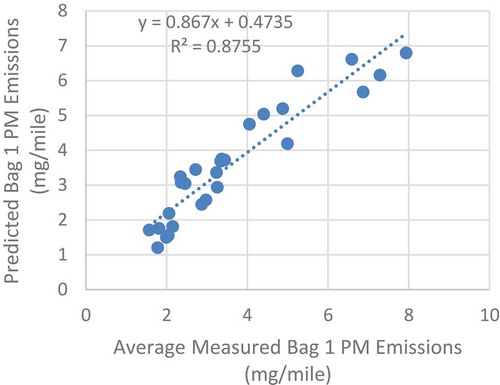
Figure 12. Fit of the 17 term EPAct model with the EPAct measurements
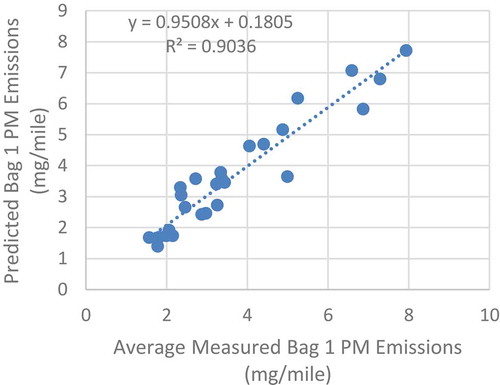
Figure 13. Fit of the Butler et al. PMI model with the EPAct measurements
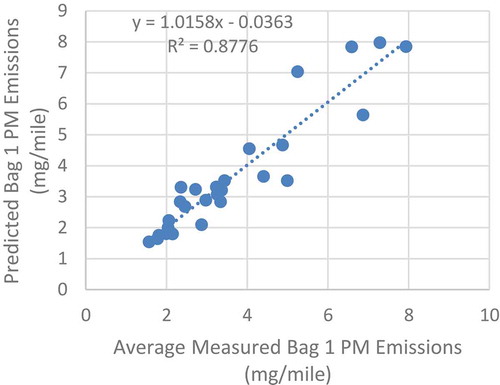
Figure 14. Fit of the Darlington et al. model with the EPAct measurements
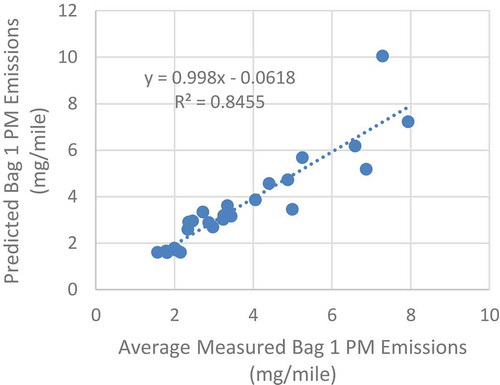
Figure 15. Fit of the Gunst reduced model with the EPAct measurements
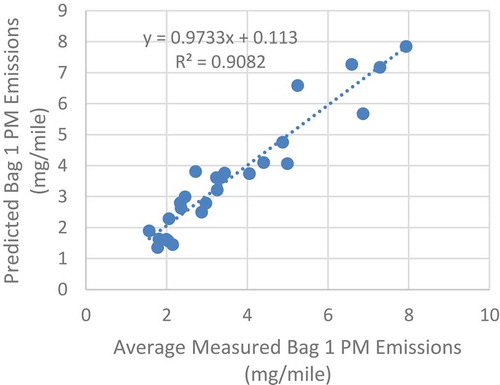
Table 3. SR0 and SR10 fuels were matched as closely as possible using two combinations of two study fuels used in the EPAct study
Figure 16. The distillation curve for the SR10 is compared with the computed curve for a mix of EPAct fuels 6 and 11
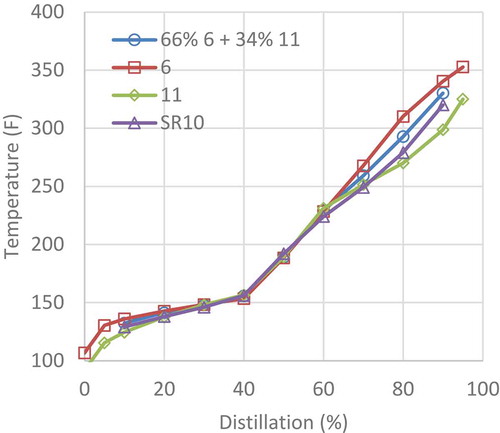
Figure 17. The distillation curve for SR0 compared with the computed curve for a mix of EPAct fuels 8 and 13
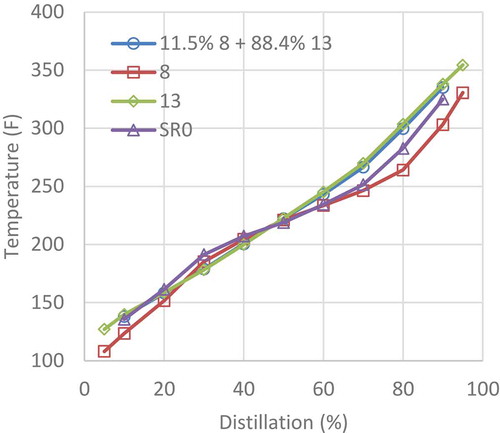
Table 4. Emissions of LA 92 phase 1 PM from SR0 and SR10 estimated from proportioned emissions from actual EPAct vehicle data (in mg/mile)
Table 5. Five models were employed to predict PM emissions from phase 1 of the LA92 in pursuit of determining the emissions difference between SR10 and SR0. Prediction for SR15 is also shown
Table 6. Phase 1 NOx emissions as measured and predicted using the EPAct models
Table 7. Phase 1 E10/E0 NOx emissions ratios for apportioned EPAct fuel blends and representative summer regular AKI fuels
Figure 18. Measured and predicted percentage differences between GDI E10 fuel emissions and GDI E0 fuel emissions. [A/C represents emissions increase on E10 fuel A relative to emissions on E0 fuel C]
![Figure 18. Measured and predicted percentage differences between GDI E10 fuel emissions and GDI E0 fuel emissions. [A/C represents emissions increase on E10 fuel A relative to emissions on E0 fuel C]](/cms/asset/8b62b620-2df1-4fe6-bba0-e50a88c8942b/uawm_a_1754964_f0018_oc.jpg)
Figure 19. Effect of 10% ethanol blending on Phase 1 PM emissions from CRC GDI studies (E-94-2, E-94-3, E-129). Number of vehicles in each average is in parentheses. E-94-2 three and four vehicle groups represent the same vehicle groups as for E-94-3. The E-129 vehicle group differs. The Yang et al. result compares a 29% aromatic E0 and a 21% aromatic E10
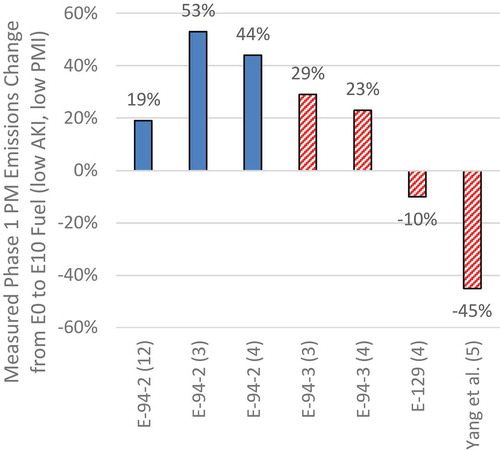
Figure 20. Comparison of emissions from E10 in comparison to E0, showing ratios of LA92 Phase 1 PM emissions for E-94-2 (MB, with 12 vehicles), E-94-3 (SB, with 3 and 4 vehicles), and E-129 (SB 4 vehicles). Both MB and SB emissions predicted emissions ratios are also presented for five models of the EPAct data
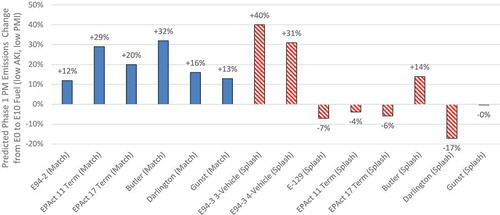
Figure 21. The E-94-2 fuels were paired to have similar AKI and PMI properties, and the ratio of the E10 fuel PM emissions to the E0 fuel PM emissions was compared for Phase 1 of the LA92. The splash blends were also included
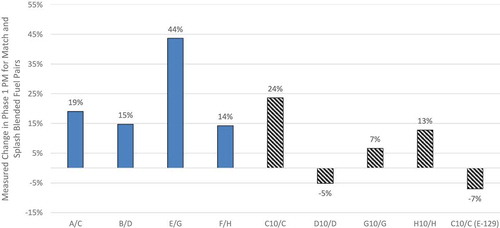
Table 8. Three groups of EPAct fuels, each with an E0, an E10, and an E15 fuel, selected to match other properties as closely as possible to determine the ethanol effect
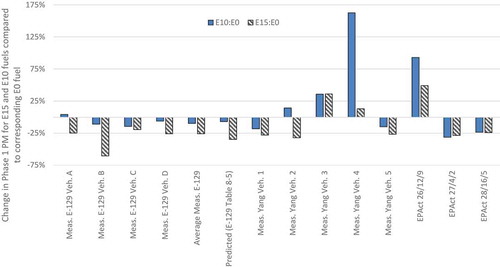
Figure 22. Comparison of E10/E0 and E15/E0 Phase 1 LA92 PM ratios for E-129, Yang et al., and selected EPAct fuel triplets (shown in )