
Figures & data
Figure 1. Time series of log UFP, 1999–2018.
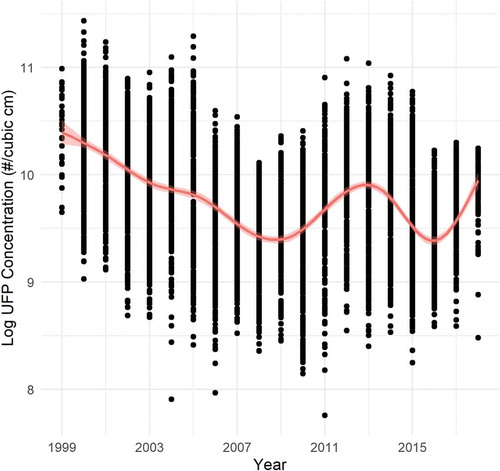
Figure 2. Time series of PM2.5 mass, 1999–2018.
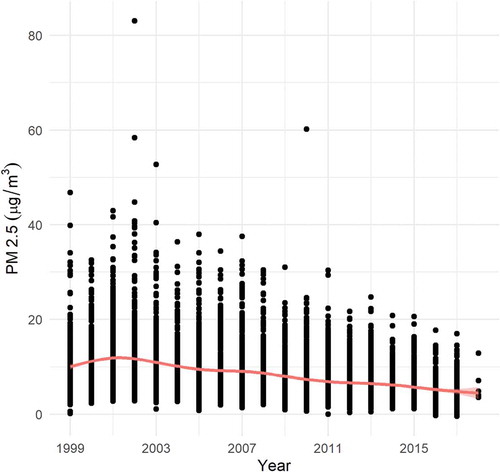
Figure 3. Time series of S, 1999–2018.
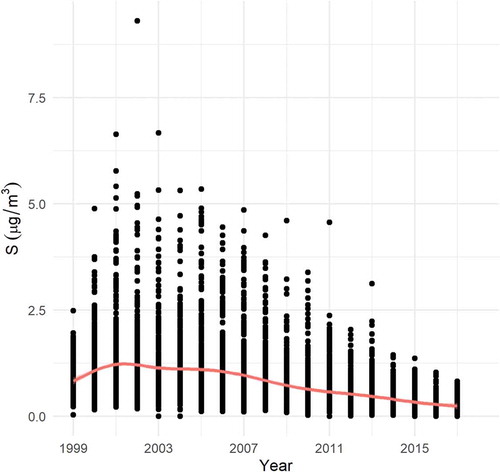
Figure 4. Estimated Annual UFP Penalties Due to PM2.5 Mass and S Trends.
Table 1. Comparison of estimated annual and study period UFP penalties in full model vs. model without date categories.