Figures & data
Figure 1. Structure of the absorption tower.
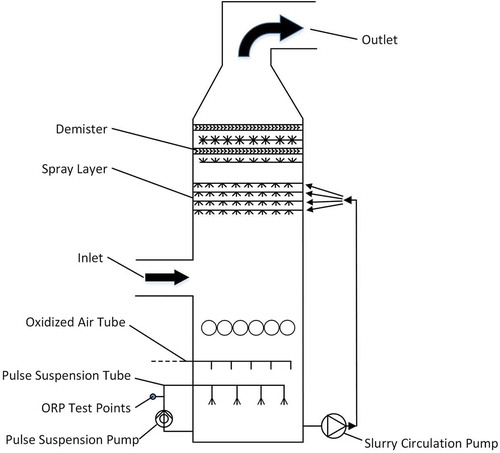
Table 1. Experimental drugs and instruments.
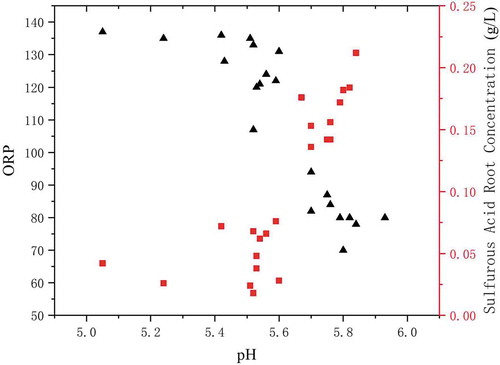
Figure 2. Test data characteristics.
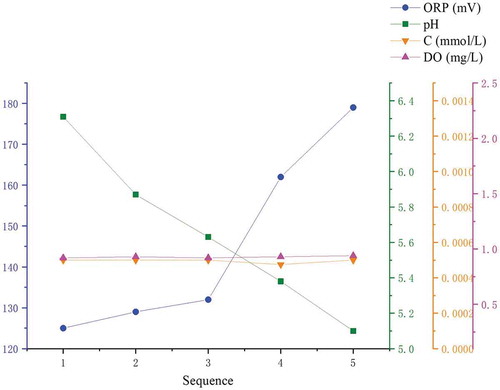
Table 2. Model analysis.
Figure 3. Comparison of actual measured values and fitting results.
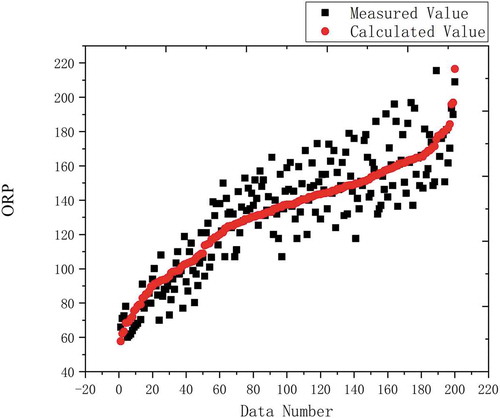
Figure 4. Gypsum SEM generated under low ORP and normal ORP conditions.
(a) Under low ORP conditions. (b) Under normal ORP conditions.
Figure 5. Calcium sulfite SEM.
Figure 6. Comparison of sulfite concentration.
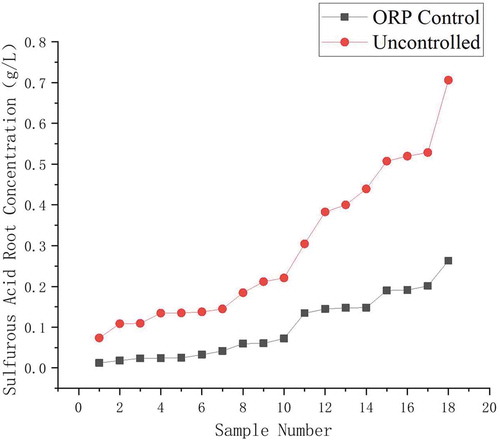
Figure 7. Changes in ORP, pH, and sulfite concentration.