Figures & data
Figure 1. Different scales of dust collectors and corresponding collecting dust mechanism.
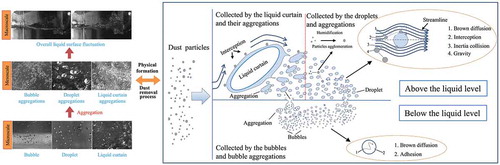
Figure 2. The analysis flowchart of this paper.
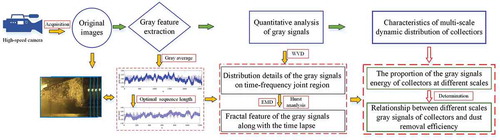
Figure 3. Structure of the dust scrubber.
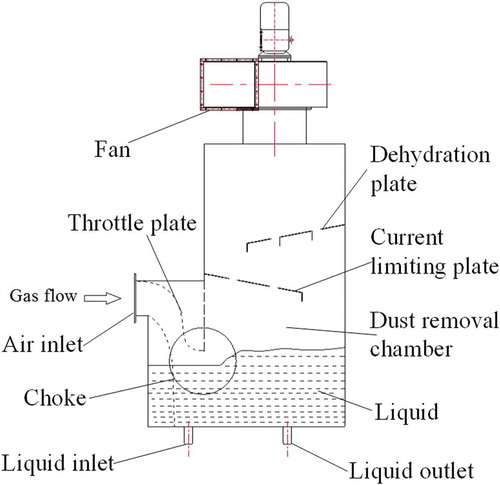
Figure 4. Measuring device and test element layout method.
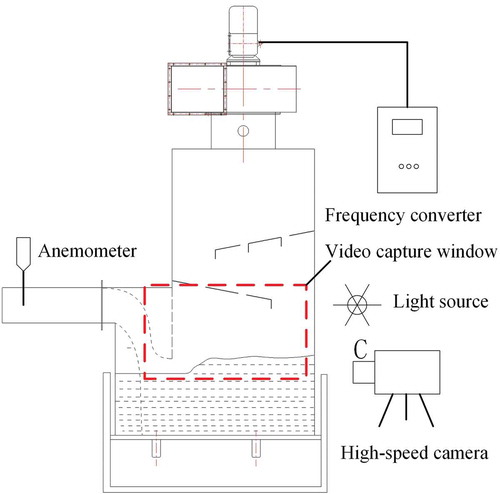
Figure 5. (a–d). Four typical patterns of collector flow (a).
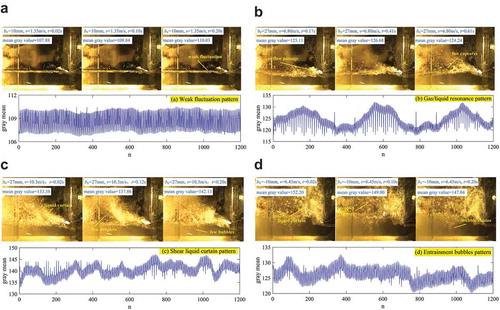
Figure 6. The dust removal efficiency of different patterns.
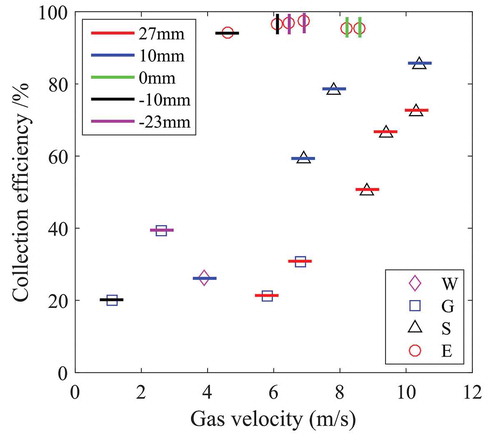
Figure 7. Values of gray signal statistic parameter of different data lengths.
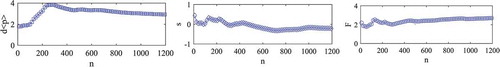
Figure 8. The WVD analysis results of the gray signals of different operating parameters.
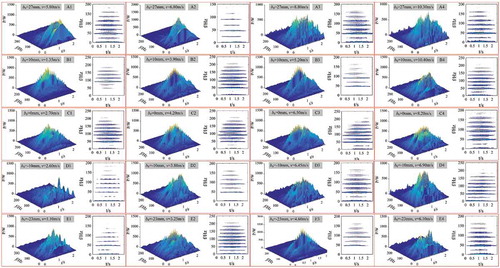
Figure 9. Dust collectors’ distribution characteristics of different operating parameters.
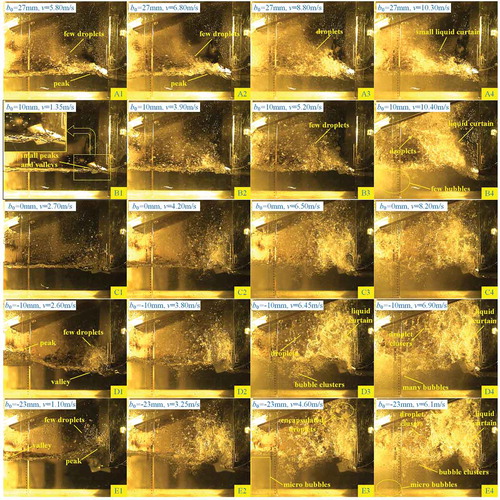
Figure 10. The EMD analysis results of the gray signals of different collector patterns.
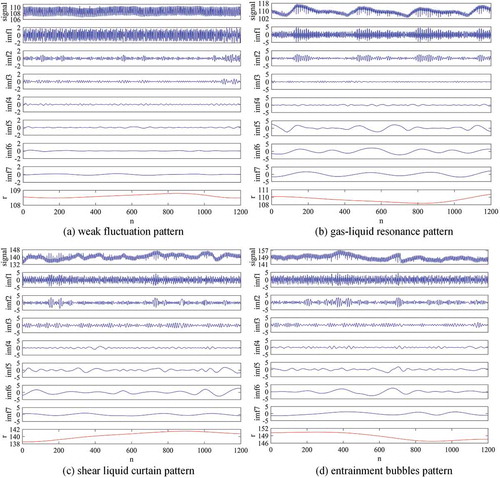
Figure 11. The Hurst analysis results of the gray signals of different operating parameters.
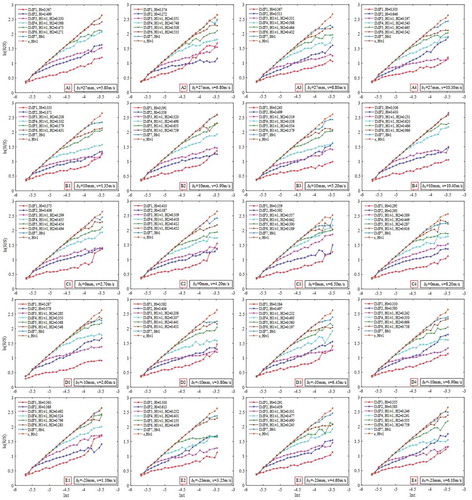
Figure 12. Fractal dimension versus scale for different collector flow patterns.
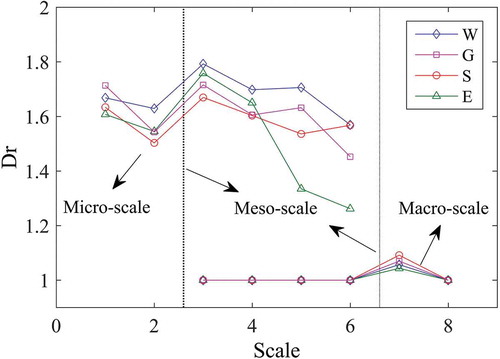
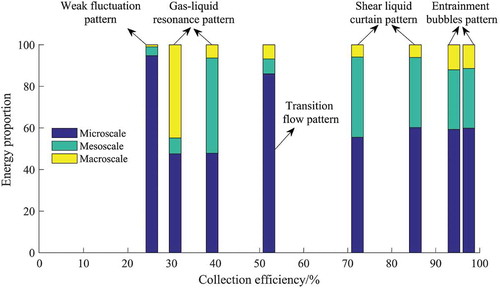
Figure 13. The relative energy contributions rule of different scale dust collectors at different collection efficiency.