Figures & data
Figure 1. Map of Thohoyandou landfill.
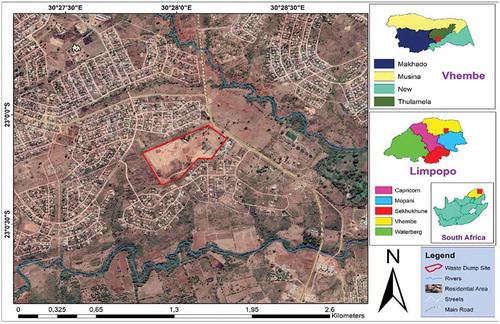
Table 3. Economic and financial results for the implementation of an LFG technology in Thohoyandou landfill site.
Table 1. Input data for the simulation of LFG to run the LandGEM and Afvalzorg models.
Figure 2. Pie chart showing the average annual composition of waste present in the Thohoyandou landfill (Source: Thulamela Municipality and SAWIC website).
Table 2. Value of DOC in Southern African region.
Figure 3. Graphical representation of the CH4 and CO2 emitted from Thohoyandou landfill site using the LandGEM model.
Figure 4. Graphical representation of CH4 emitted from Thohoyandou landfill site using the Afvalzorg model (k value = 0.05).
Figure 5. Comparison of the simulation of CH4 using the Afvalzorg and LandGEM models for the Thohoyandou landfill site.
Figure 6. Graphical representation CH4 emitted from Thohoyandou landfill site using the LandGEM model at k = 0.03 and 0.05.
Figure 7. Graphical representation of CH4 emitted from Thohoyandou landfill site using the Afvalzorg model at k = 0.03 and 0.05.
Table 4. The conversion of methane to tonnes of CO2e for Thohoyandou landfill.
Table 5. Annual electricity generated in kWh for the different LFG engines for Thohoyandou landfill.
Table 6. Average electricity per year generated and the number of household beneficiaries from the Thohoyandou landfill site project.
Figure 8. A graphical representation of the LFG generated, collected and utilized from the implementation of an LFG utilization technology in Thohoyandou landfill site.