Figures & data
Table 1. Chemical composition of spent catalyst.
Table 2. Results of the leaching process.
Figure 1. Effect of initial pH on molybdenum extraction behavior with different extractants under the same extractants concentration, extraction time, and O/A ratio.
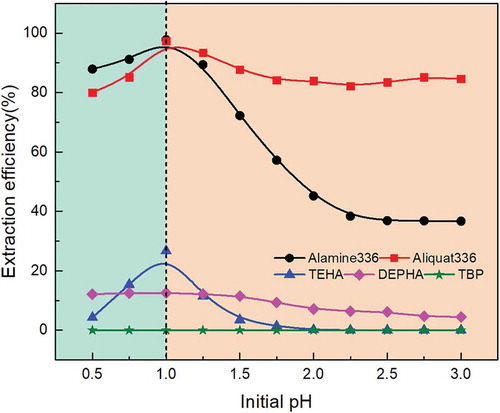
Figure 2. Effect of extractants concentration on molybdenum extraction behavior with different extractants under the same initial pH, extraction time, and O/A ratio.
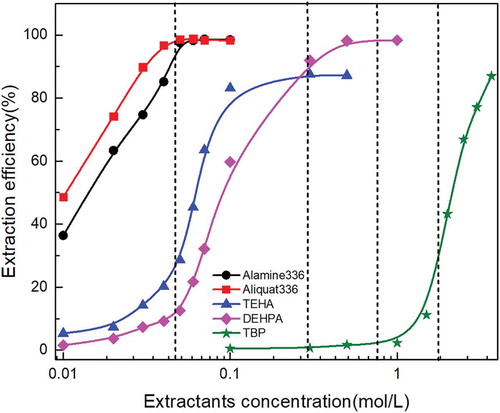
Figure 3. Molybdenum extraction slope analysis for five different extractants under the same initial pH, extraction time, and O/A ratio.
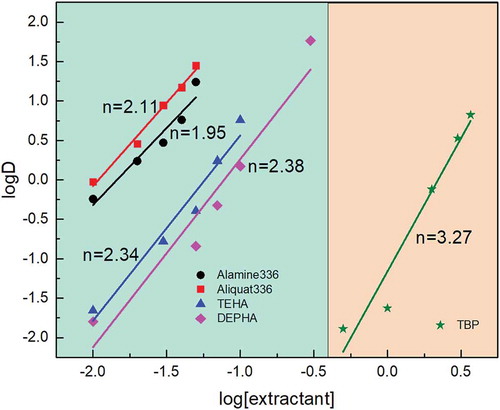
Figure 4. Effect of extraction time on molybdenum extraction behavior with different extractants under the same extractants concentration, initial pH, and O/A ratio.
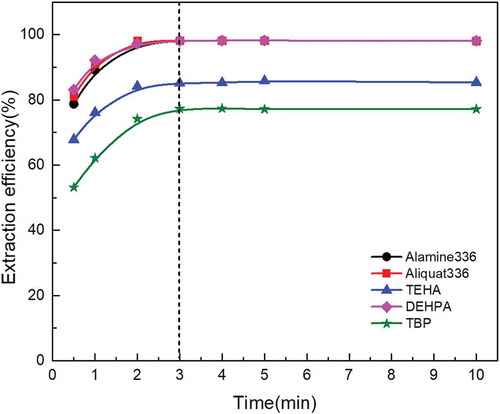
Figure 5. McCabe–Thiele plot for molybdenum extraction with 0.05 mol/L Alamine 336 at initial aqueous pH of 1 and extraction time of 5 min.
Table 3. Results of the two-stage counter current extraction of molybdenum.
Figure 6. Effect of stripping agent concentration on molybdenum stripping behavior with different stripping agent under the same stripping time and O/A ratio.
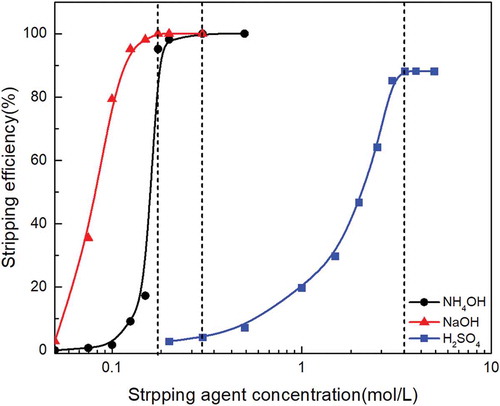
Figure 7. Effect of stripping time on molybdenum stripping behavior with different stripping agent under the same stripping agent concentration and O/A ratio.
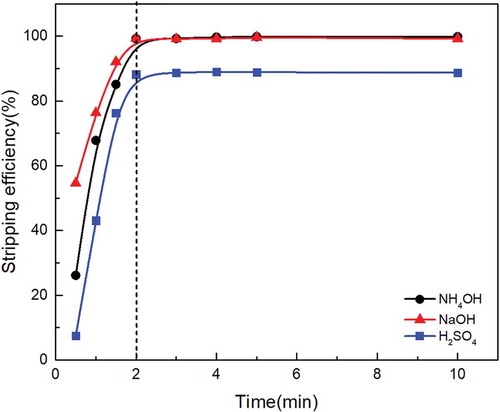
Figure 8. McCabe–Thiele plot for molybdenum stripping with 0.15 mol/L NaOH and 4 min stripping time.
Table 4. Results of the two-stage counter current stripping of molybdenum.
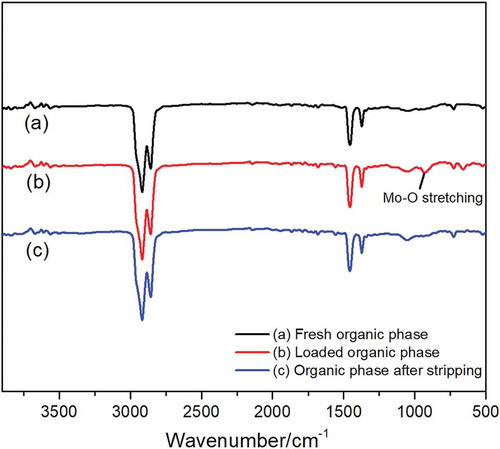
Figure 9. FTIR spectra of organic phase during extraction and stripping process (a) fresh organic phase, (b) loaded organic phase, and (c) organic phase after stripping.