
Figures & data
Table 1. Comparison of IED-ELVs with WI-BREF BAT-AEL values (heavy metals).
Table 2. Examples of different rules for summation for the results which are below either LOD or LOQ.
Table 3. Examples of the summation of concentrations which are below LOQ (marked with “<”).
Table 4. Final results calculated with different methods (A, B, and C) based on the measured concentrations given in and compared with BAT-AEL ranges.
Table 5. Average emission limit values for heavy metals at a waste-to-energy plant, values given at NTP (NTP specified in Europe as 273.15 K and 101.3 kPa).
Table 6. Limits of quantification (LOQ) given by analytical laboratories (µg/l) for the absorption solution.
Figure 1. Hg-concentration results measured by stack testing teams A, B, C and D, 8.5.2019, waste-to-energy plant, Finland.
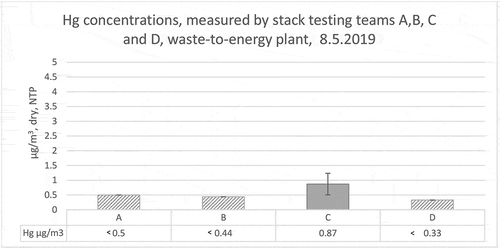
Figure 2. Hg-concentration results measured by stack testing teams E (result below LOQ), F and H (* team H only had results from gaseous phase), 15.5.2019, waste-to-energy plant, Finland.
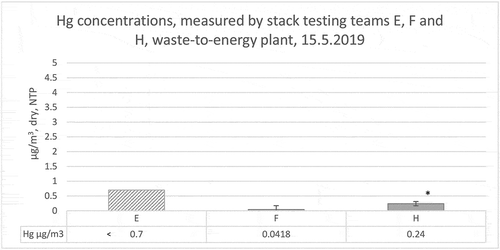
Figure 3. Sum of Cd and Tl concentrations measured by stack testing teams A, B, C and D, 8.5.2019, waste-to-energy plant, Finland.
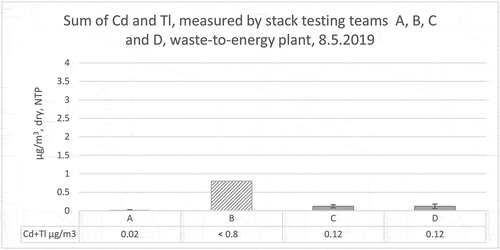
Figure 4. Sum of Cd and Tl concentrations measured by stack testing team E (below LOQ), F, G (below LOQ) and H (* stack testing team H only had results from gaseous phase), 15.5.2019, waste-to-energy plant, Finland.
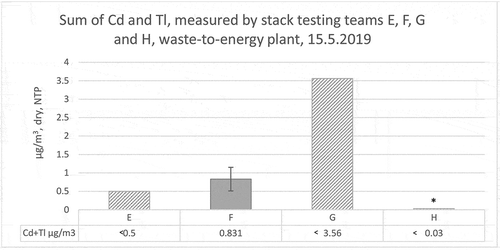
Figure 5. Sum of heavy metal concentrations (As, Cr, Co, Cu, Mn, Ni, Pb, Sb and V) measured by stack testing teams A, B, C and D, 8.5.2019, waste-to-energy plant, Finland.
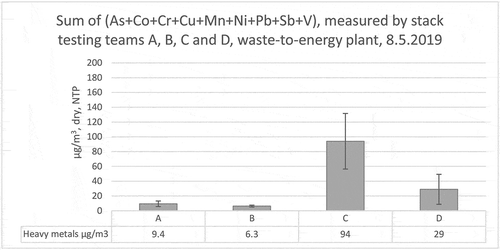
Figure 6. Sum of heavy metal concentrations (As, Cr, Co, Cu, Mn, Ni, Pb, Sb and V) measured by stack testing teams E, F, G (below LOQ) and H (* stack testing team H had only results from gaseous phase, result below LOQ), 15.5.2019, waste-to-energy plant, Finland.
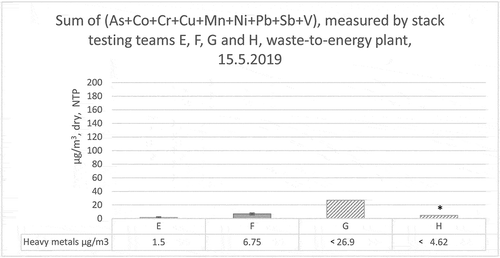
Table 7. Measurement uncertainties reported by stack testing teams (A-H) for heavy metals, Cd + Tl and Hg, ILC, 2019, Finland.
Figure 7. Hg distribution (stack testing teams A, B, C, D, E and F) to particulate and gaseous phases at ILC in 2019.
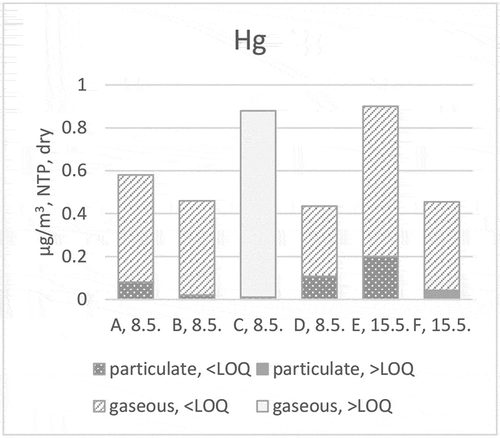
Figure 8. Sb distribution (stack testing teams A, B, C, D, E and F) to particulate and gaseous phases at ILC in 2019.
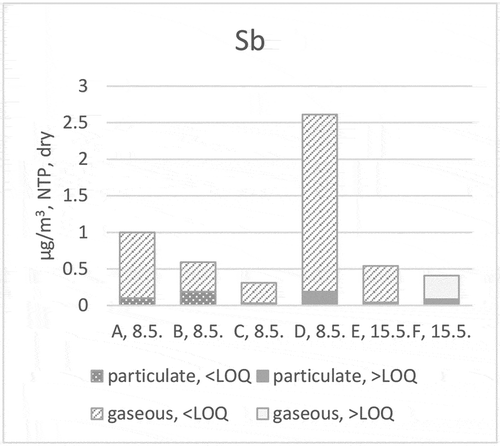
Figure 9. Cd distribution (stack testing teams A, B, C, D, E and F) to particulate and gaseous phases at ILC in 2019.
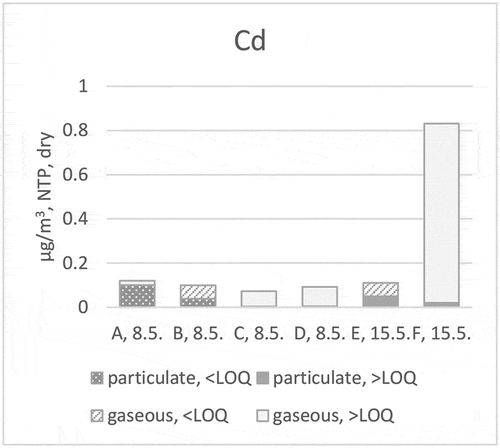
Figure 10. Tl distribution (stack testing teams A, B, C, D, E and F) to particulate and gaseous phases at ILC in 2019.
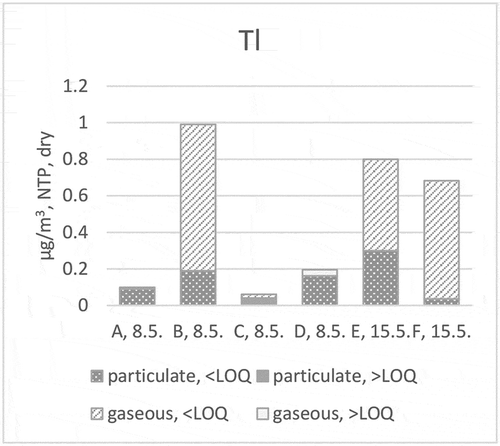
Figure 11. As distribution (stack testing teams A, B, C, D, E and F) to particulate and gaseous phases at ILC in 2019.
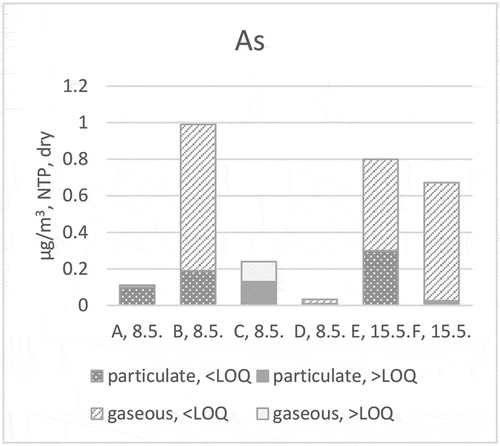
Figure 12. Co distribution (stack testing teams A, B, C, D, E and F) to particulate and gaseous phases at ILC in 2019.
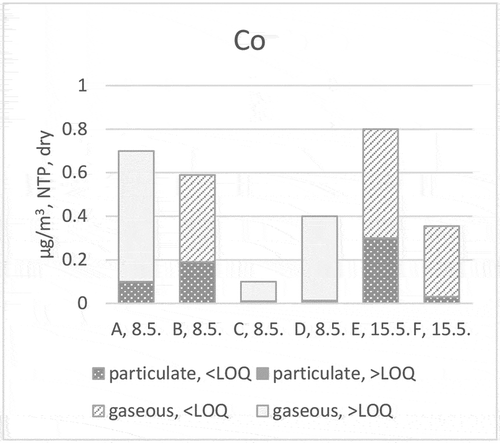
Figure 13. Cr distribution (stack testing teams A, B, C, D, E and F) to particulate and gaseous phases at ILC in 2019.
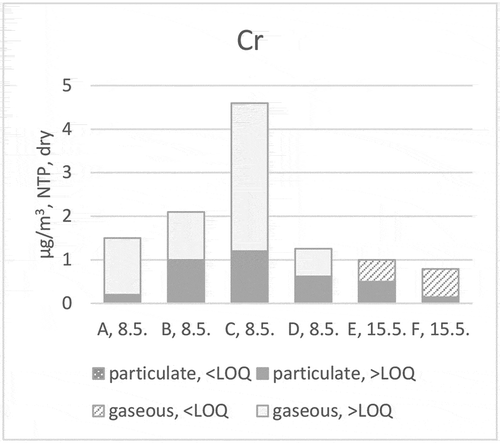
Figure 14. Ni distribution (stack testing teams A, B, C, D, E and F) to particulate and gaseous phases at ILC in 2019.
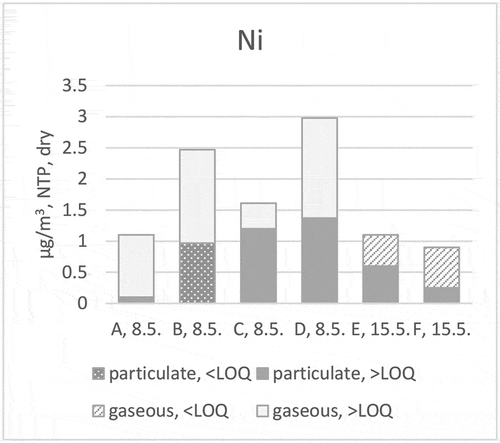
Figure 15. Cu distribution (stack testing teams A, B, C, D, E and F) to particulate and gaseous phases at ILC in 2019.
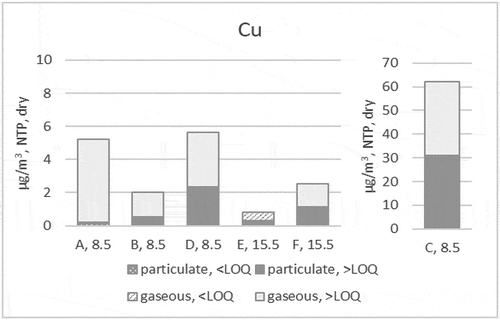
Figure 16. Pb distribution (stack testing teams A, B, C, D, E and F) to particulate and gaseous phases at ILC in 2019.
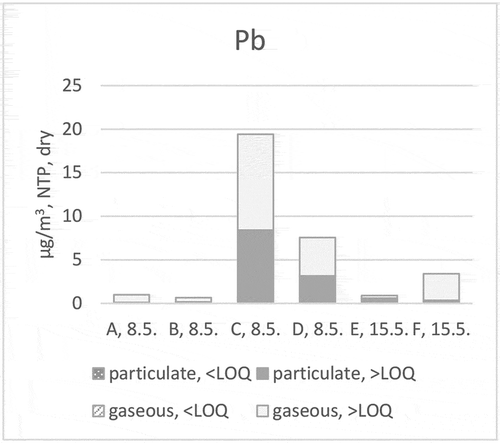
Figure 17. Mn distribution (stack testing teams A, B, C, D, E and F) to particulate and gaseous phases at ILC in 2019.
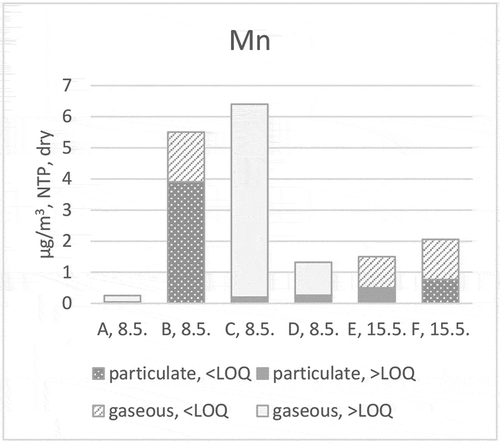
Figure 18. V distributions (stack testing teams A, B, C, D, E and F) to particulate and gaseous phases at ILC in 2019.
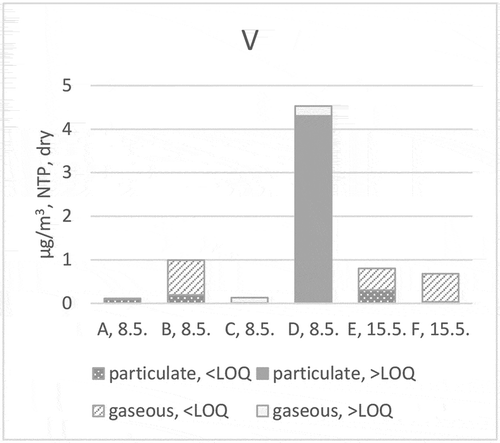
Table 8. Particulate phase (heavy metals) reported by stack testing teams A, B, C, D, E, and F, ILC, May 2019, Finland.
Table 9. Gaseous phase (heavy metals) reported by stack testing teams A, B, C, D, E, and F, ILC, May 2019, Finland.
Table 10. Comparison of chemical analysis, sample taken on 8.5.2019, waste-to-energy plant.
Table 11. Comparison of chemical analysis, sample taken on 9.5.2019, waste-to-energy plant.