Figures & data
Figure 1. Sample one-week time series of AQHI, AQHI-Plus, and fine particulate matter (PM2.5) hourly values from 2015 in Howe Sound, an area with both wildfire and residential wood burning impacts. Vertical x-axis lines represent the 00:00 hour mark of that day in the time series.
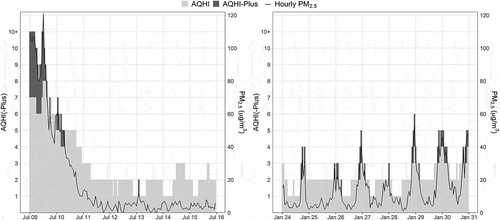
Figure 2. Local Health Area (LHA) boundary map of British Columbia displaying LHAs included in the study and locations of the Air Quality Health Index (AQHI) and weather stations.
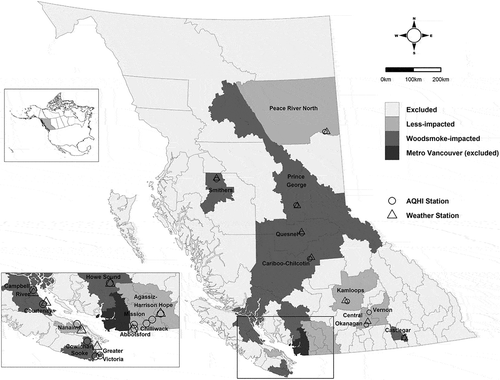
Table 1. Results from the woodsmoke-impacted detection algorithm sorted by percentage of days with data that were classified as woodsmoke-impacted. The study period included 1,698 days during the months of October to April, beginning January 1, 2010 and ending December 31, 2017.
Figure 3. Mean fine particulate matter (PM2.5) plotted by Local Health Area (LHA), time of day, and month. LHAs are ordered by the percent of woodsmoke impacted days (). The PM2.5 values are standardized within their respective LHA. Months with intense wildfire activity are excluded (July to September in 2010, 2014, 2015, and 2017).
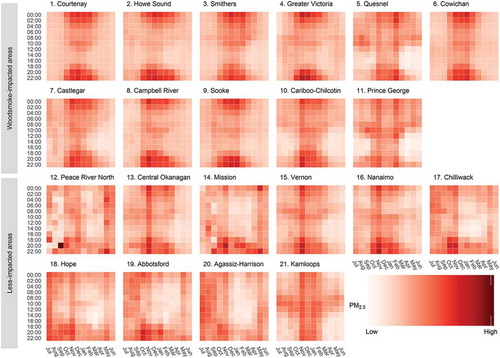
Table 2. Summary descriptions of the woodsmoke-impacted areas compared with the less-impacted areas.
Figure 4. The percentage of hours during which the Air Quality Health Index (AQHI) was overridden by a greater AQHI-Plus value, shown by Local Health Area (LHA), time of day, and month. The LHAs are ordered by the percent of woodsmoke-impacted days (). Months with intense wildfire activity are excluded (July to September in 2010, 2014, 2015, and 2017).
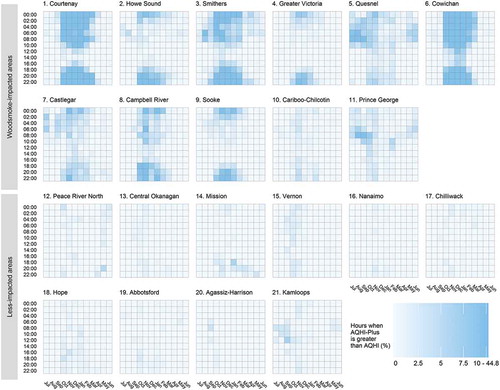
Table 3. Frequency distribution of Air Quality Health Index (AQHI) and AQHI-Plus daily values used in the study for the woodsmoke-impacted areas.
Table 4. AIC values for models fit for the AQHI and AQHI-Plus to each health outcome, controlling for both 21-day rolling average apparent temperature and same-day apparent temperature.
Figure 5. Relative rates and confidence intervals for 1-unit increases in the AQHI and AQHI-Plus for each health outcome: i) controlling for both 21-day rolling average apparent temperature and same-day apparent temperature; ii) controlling for same-day apparent temperature; and iii) without any temperature control. For models with both long- and short-term temperature controls, model fit was assessed using the Akaike information criterion (AIC), where a lower value indicates a better fit.
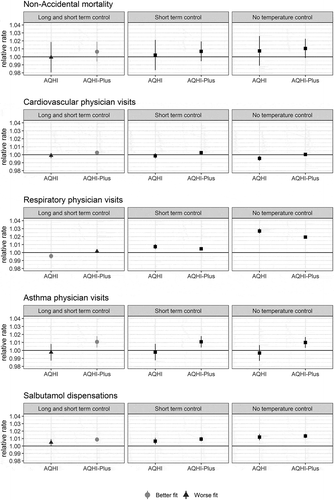
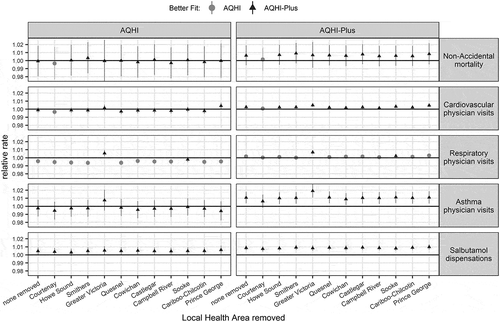
Figure 6. Relative rates and confidence intervals for 1-unit increases in the AQHI and AQHI-Plus for each health outcome for the leave-one-out sensitivity analysis of Local Health Areas (LHAs). Models are adjusted for 21-day rolling average apparent temperature and same-day apparent temperature. Removed LHAs are ordered left-to-right by the percent of woodsmoke-impacted days ().