Figures & data
Figure 1. The rule of cellular neighbor
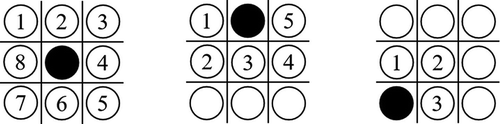
Figure 2. The evolution over time of the proportion of residents who participate in classifying MSW when the MSWMCP is not implemented
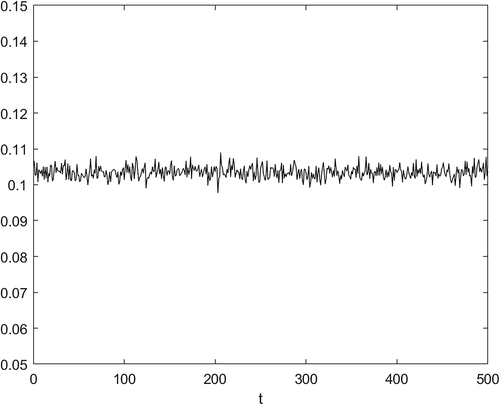
Figure 3. The residents’ status without the implementation of MSWMCP
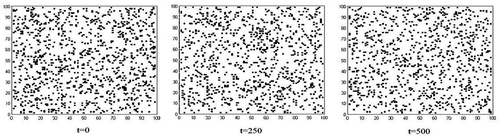
Figure 4. The evolution over time of the proportion of residents who participate in classifying MSW with the implementation of MSWMCP at t = 100
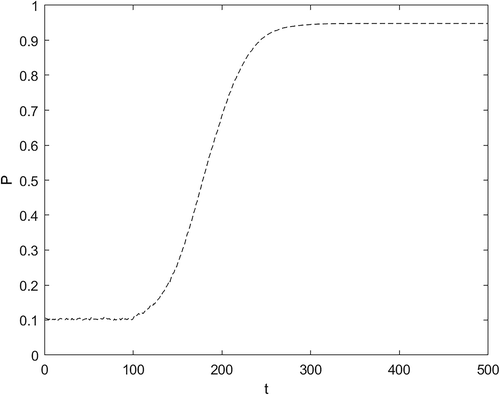
Table 1. Simulation parameters of different implementation intensities
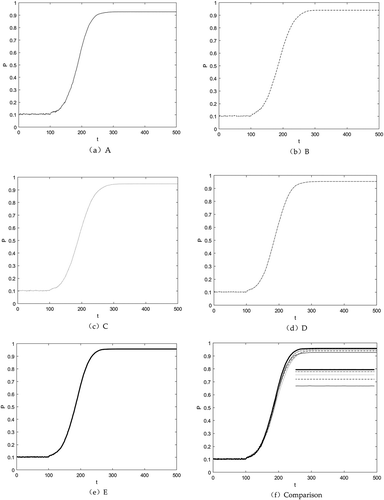
Figure 5. Simulation of the policy effect of MSWMCP with different implementation intensities
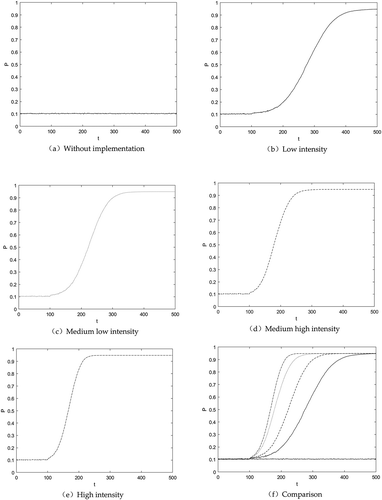
Table 2. Simulation parameters of different population sizes
Figure 6. Simulation of the implementation effect of MSWMCP under different urban population sizes