Figures & data
Figure 1. Bogotá´s land-use information and sampling points for RD10 in the wet period (points 21 to 41) and the dry period (points 1 to 20)
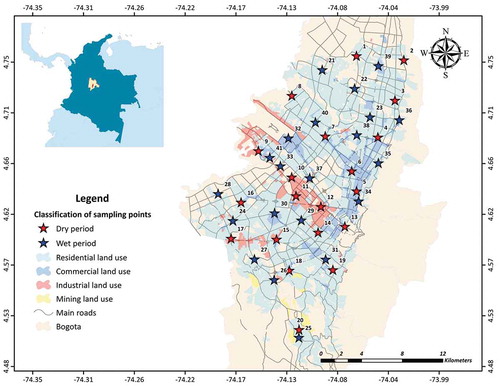
Table 1. On-site and off-site information on factors influencing road dust loadings
Table 2. Ranking of on-site observations influencing dust loadings
Table 3. Off-site factors influencing dust loadings
Table 4. Dust loadings during the sampling campaigns conducted in Bogotá
Figure 2. Road dust loadings estimated for Bogotá in the wet period (a) and the dry period (b)
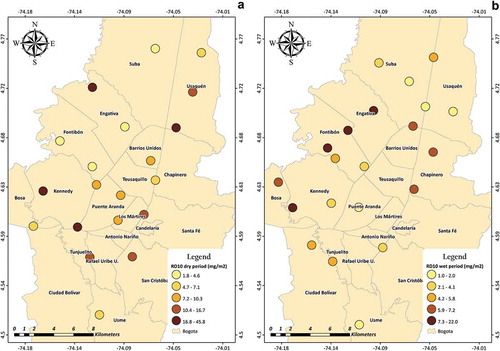
Figure 3. Analysis of factors influencing road dust from on-site observations, wet period (gray bars) and dry period (black bars), error bars represent minimum and maximum values
Figure 4. Analysis of factors influencing road dust, wet period (gray points) and dry period (black points)