Figures & data
Figure 1. Location of the Tula-Vito-Apaxco industrial corridor (TVAIC) in central Mexico. The dark color corresponds to urban areas; the MCMA corresponds to the gray spot in the center that extends north of Mexico City.
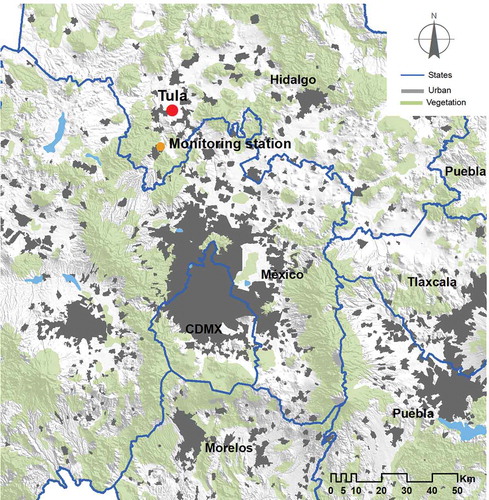
Table 1. Maximum permissible emission levels for thermoelectric indirect heating combustion equipment, NOM-085-SEMARNAT-2011 (DOF Citation2012).
Figure 2. Temporal annual average air pollutant reduction from 1990 to 2017 within the MCMA.
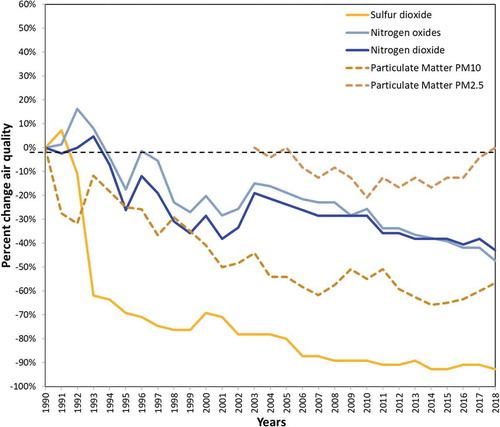
Table 2. Emission factors used in this study for criteria pollutants, calorific values and sulfur contents for fuel oil and natural gas.
Table 3. Technical specification of the generating units at the CTFPR.
Figure 3. Comparison of the total annual emissions (sum of the five generating units) during 2010, for fuel oil and natural gas consumption at the CTFPR.
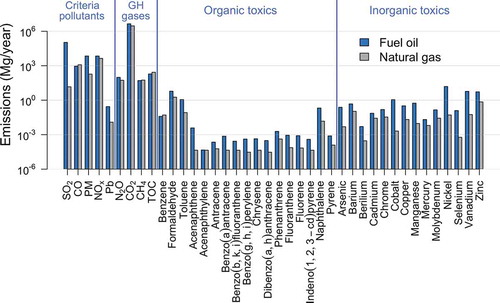
Figure 4. Comparison of total daily emissions of SO2, CO, NOx, Pb, PM and CO2, for fuel oil and natural gas consumption during 2010. SO2 and PM have logarithmic y-axis scales.
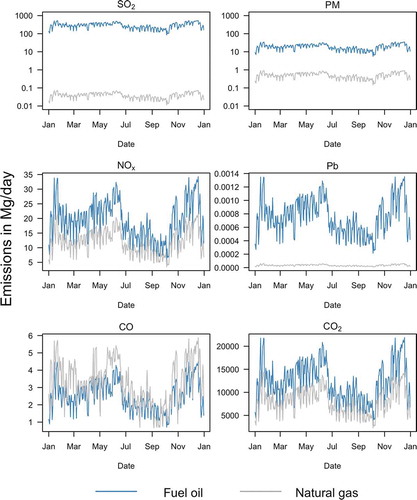
Figure 5. Wind roses for the cold-dry, warm-dry and warm-wet seasons in the CECATI station in Tepeji del Río, March 2010 – February 2011.
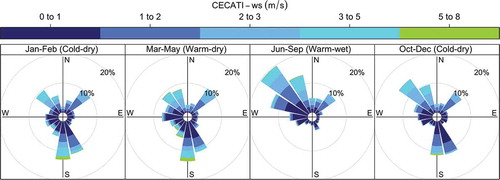
Figure 6. Wind roses for the cold-dry, warm-dry and warm-wet seasons for the northern part of the MCMA, January – December 2010.
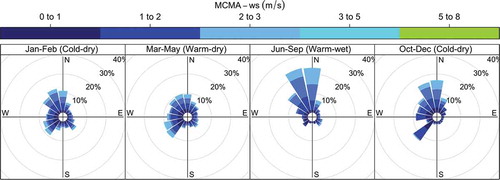
Figure 7. Hourly SO2 concentrations (μg/m3) estimated by CALPUFF for fuel oil consumption at the CTFPR, December 13, 2010 (12:00 LT). The CECATI meteorological station and CTFPR power plant are indicated in red.
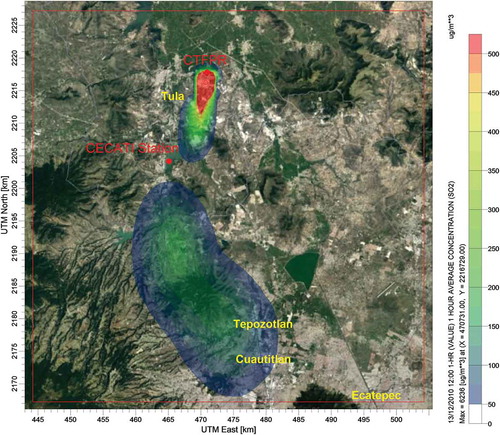
Figure 8. Comparison of measured (CECATI station) and modeled (CALPUFF) SO2 emissions for fuel oil consumption between March 4, 2010 and February 9, 2011.
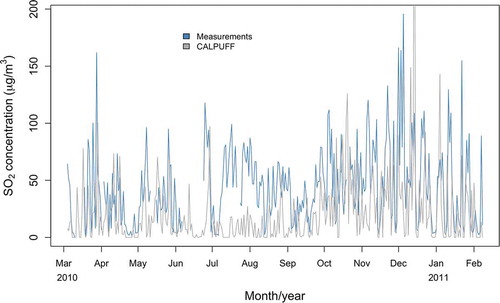
Figure 9. Temporal profile of CALPUFF simulated SO2 concentrations during 2010 for receptors > 15 km south of the CTFPR. The orange line corresponds to the Mexican AQS for 24 hr averages.
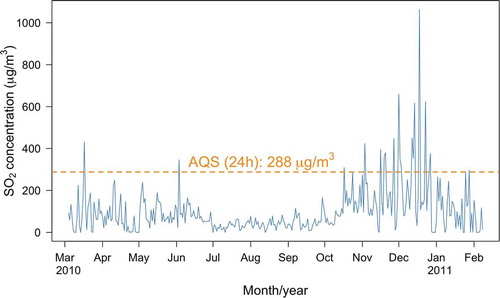
Figure 10. Box-whisker plot of simulated maximum 24 hr SO2 mass concentrations from fuel oil consumption at the CTFPR during March-December 2010 and January-February 2011.
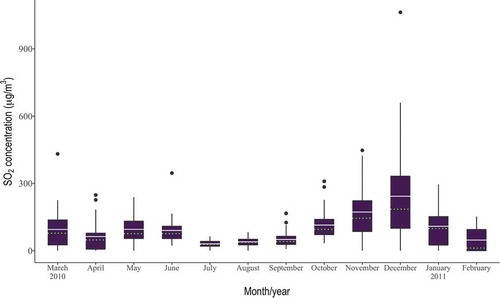
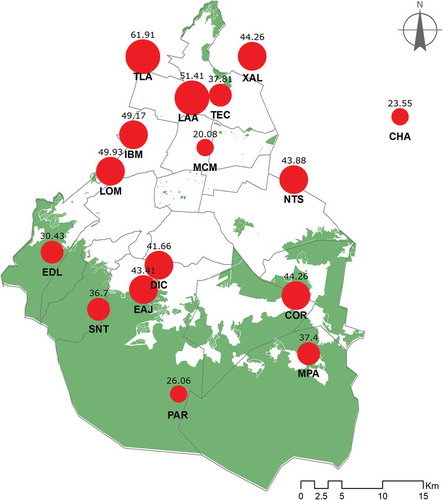
Figure 11. Spatial distribution of the 2010 daily average SO2 concentration in µg/m3 at 12 monitoring stations within the MCMA.
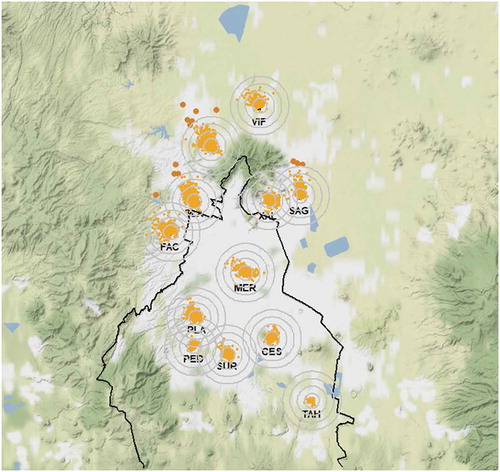
Figure 12. Box-Whisker plot of monthly distributions of 24 hr SO2 concentration at 6 northern monitoring stations (see ) within the MCMA during 2010.
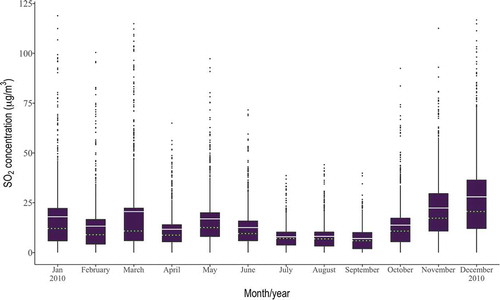
Figure 13. MCMA affectation due to SO2 emissions from the CTFPR, estimated by the AQFS-CdMX system for selected days and hours: (a) January 14, 2018 (10:00 LT), (b) March 14, 2018 (06:00 LT) and (c) April 2, 2019 (07:00 LT).
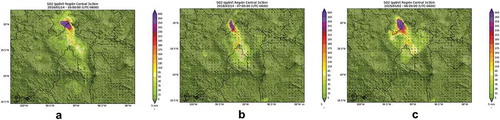
Figure 14. Annual average sulfate concentrations (µEq/L) in atmospheric wet deposit during 2010, in different sites of the MCMA: IBM Legaria (IBM), Laboratorio de Analisis Ambiental (LAA) and Tlalnepantla (TLA) at the NE; Chapingo (CHA), Netzahualcóyotl Sur (NTS), Cerro del Tepeyac (TEC) and Xalostoc (XAL) at the NW; Museo (MCM) at the Center; Diconsa (DIC), Ecoguardas Ajusco (EAJ), Ex-convento Desierto de los Leones (EDL), Lomas (LOM), Parres (PAR), San Nicolás Totolapan (SNT) at the SW; Corena (COR) and Milpa Alta (MPA) at the SE.