
Figures & data
Table 1. Weight of individual components of a typical mobile phone
Table 2. Elemental composition of different MPCB size fractions analyzed after acid digestion (Results of duplicates with Mean ± SD were reported)
Table 3. Elemental composition of MPCBs (as received) in the present study and values reported by other authors (all values in %)
Figure 1. Variation in metal content of different size fractions of the MPCB samples
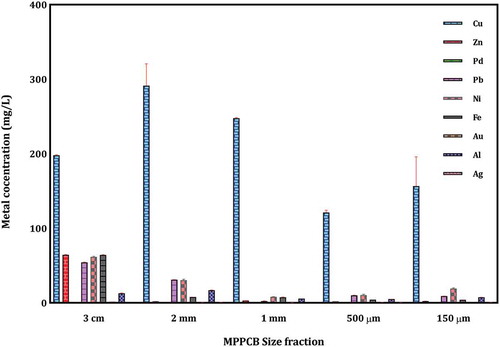
Table 4. Elemental composition of MPCB sample (150 µm) determined through energy-dispersive X-ray spectroscopy analysis (EDX)
Figure 2. Scanning electron microscopy images of MPCB (150 µm): (a) surface morphology of untreated MPCB under SEM and (b) surface morphology of acid digested MPCB under SEM
Figure 3. Energy-dispersive X-ray spectroscopy (EDX) analysis of (a–b) actual and (c–d) acid-treated MPCB sample (150 µm)
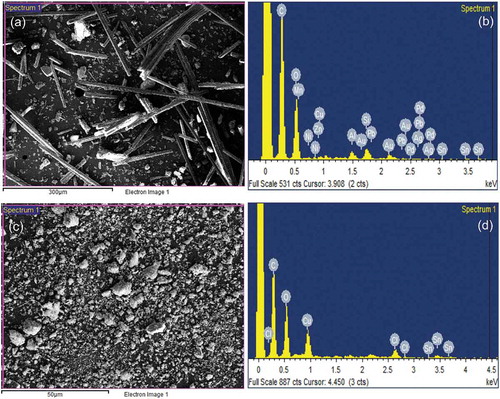
Figure 4. Mineral phases of MPCB (150 µm) sample observed under X-ray diffraction spectrometer (XRD)
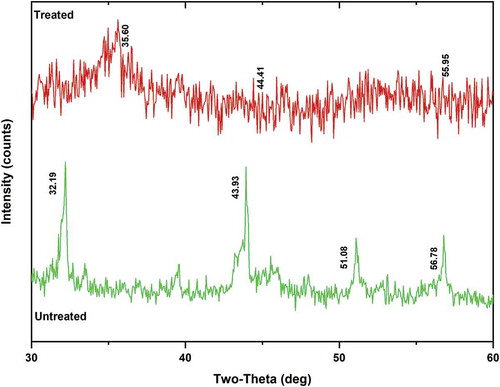
Figure 5. Fourier transform infrared spectra analysis of MPCB (150 µm) sample
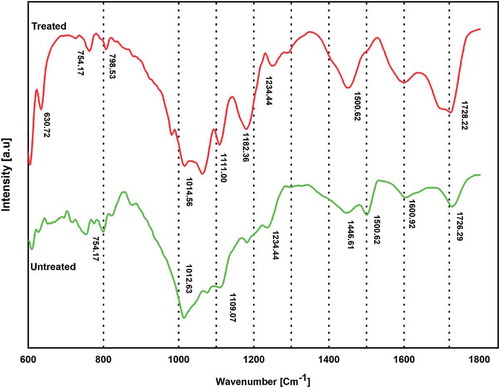
Figure 6. Chemical analysis of the TCLP leachates from milled MPCBs
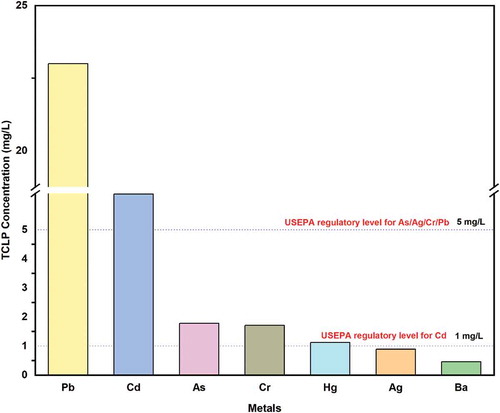
Table 5. Properties of NMF and various alternative fuels (all in %) (Capablo et al. Citation2009; Chinyama Citation2011; Sharabaroff et al. Citation2017; Zieri and Ismail Citation2018)
Table 6. Gross calorific values of NMF and various alternative fuels (Capablo et al. Citation2009; Chinyama Citation2011; Sharabaroff et al. Citation2017; Zieri and Ismail Citation2018)
Table 7. Comparison of metal content in actual mineral ores and MPCB
Table 8. Estimation of market value of metal concentrations contained in MPCBs