
Figures & data
Figure 1. Map with cities, population numbers (in thousands), location of heavy industries and coal power plants
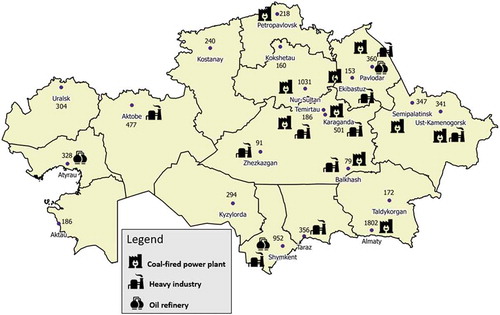
Table 1. Share of mortality rate by cause
Figure 2. Average annual PM10 concentration between 2015 and 2017 (based on TSP data) and coal consumption in the region
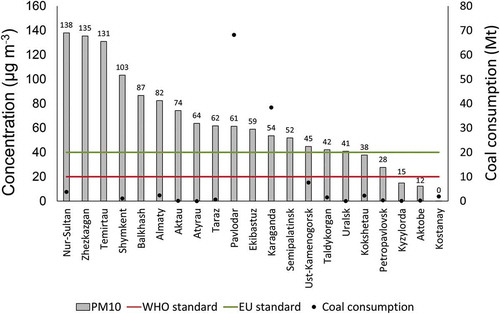
Figure 3. Ranking of the cities by the average level of NO2 (over 2015–2017) and the number of registered cars in the region
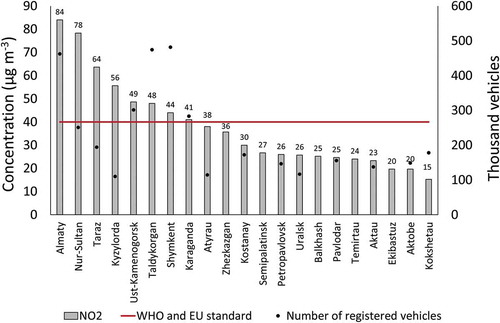
Figure 4. Ranking of the cities by the average concentration of SO2 (over 2015–2017) and coal consumption in the region
Figure 5. Ranking of the cities by the average annual concentration of O3 (over 2015–2017) and the number of registered cars in the region
Figure 6. Trends in average annual concentrations of PM10 (left) and NO2 (right) in Nur-Sultan
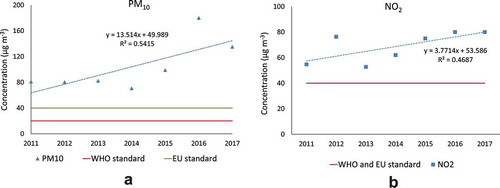
Figure 7. Trends in average annual concentrations of PM10 (left) and NO2 (right) in Almaty
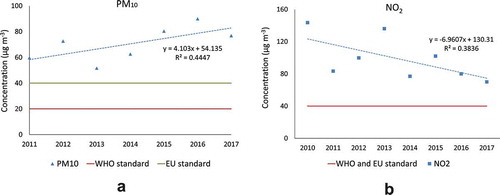
Figure 8. Average annual concentrations of PM10 (left) and NO2 (right) in Ust-Kamenogorsk
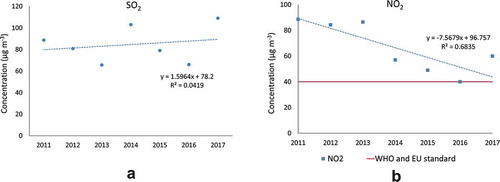
Figure 9. Average annual concentration level of O3 (left) and NO2 (right) in Aktobe
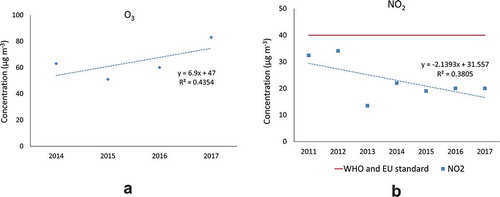
Table 2. Additional morbidity cases due to exposure to PM10 in the major cities (annually over the 2015–2017)
Table 3. Additional NCD+LRI mortality cases by age ranges due to exposure to PM2.5 in the major cities of Kazakhstan (annually over the 2015–2017) (SE-standard error; SE for parameter obtained from Burnett et al. Citation2018)
Table 4. Additional COPD, LC, LRI, IHD, and stroke mortality cases due to exposure to PM2.5 in the major cities of Kazakhstan (annually over the 2015–2017)
Figure 10. Mortality rate attributable to ambient air pollution (per 105 adults) by cities of Kazakhstan
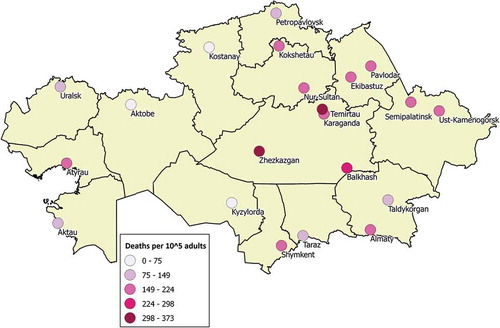
Table 5. Characteristics of the cities and estimated PM2.5 mortality