
Figures & data
Figure 1. Sampling location, National center for Physics Islamabad, Pakistan
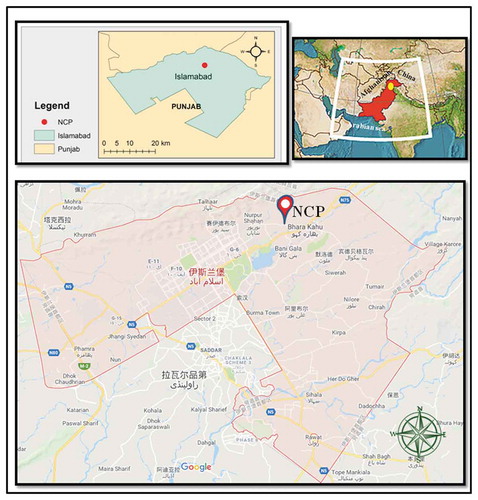
Figure 2. Mass concentration, AQI and PM2.5/PM10 ratios in pre-monsoon and post-monsoon periods
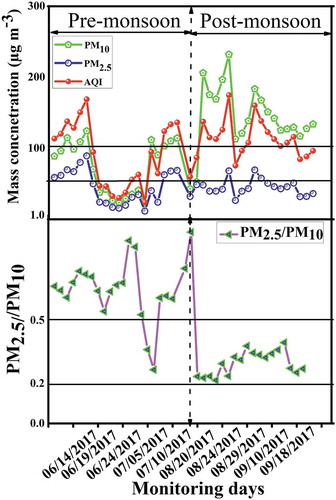
Figure 3. Statistical interactions between PM2.5 and PM10 in pre-and post-monsoon periods
Figure 4. Pre-and post-monsoon periods time series of wind roses patterns (a); Meteorological parameters (b)
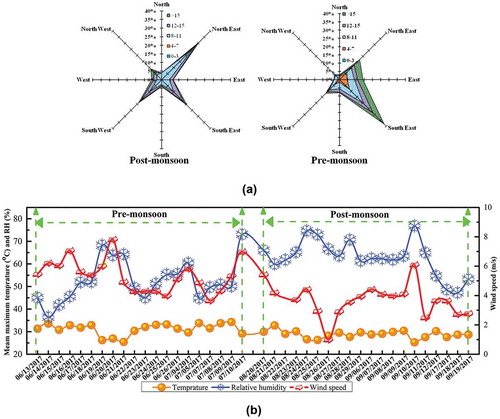
Figure 5. 48 h back trajectories of from (a) pre-monsoon and
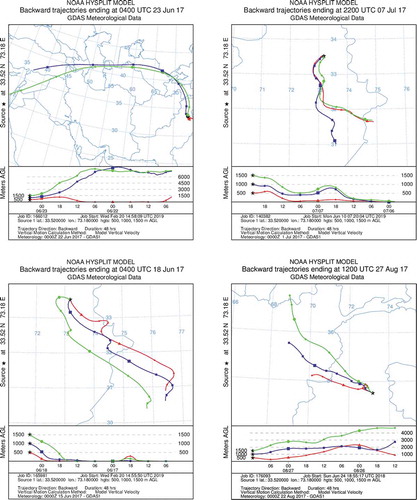
Figure 5. (b) post-monsoon period of 2017 in Islamabad showing low (l), medium (m) and high (h) polluted days
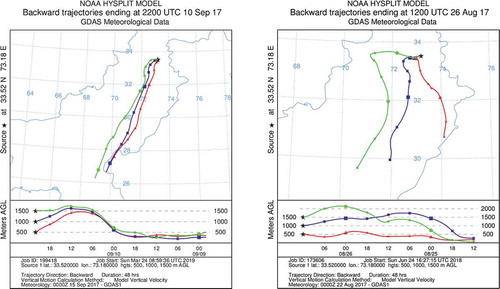
Table 1. Different health-effect endpoints in pre-monsoon and post-monsoon season due to PM10 and PM2.5 exposure
Table 2. Premature mortalities and lifetime risk associated with the mean exposures of PM10 and PM2.5 in pre-and post-monsoon