Figures & data
Figure 1. Location map of the study area
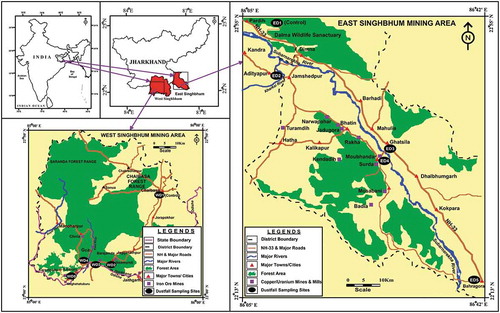
Table 1. Dustfall rates (g/m2/month) of Copper and Iron mining area
Figure 2. (a) Dustfall rates of copper mining area. (b) Meteorological parameters of copper mining area
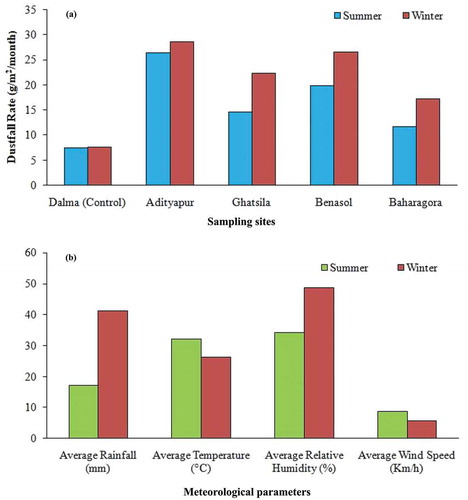
Figure 3. (a) Dustfall rates of Iron mining area. (b)Meteorological parameters of iron mining area
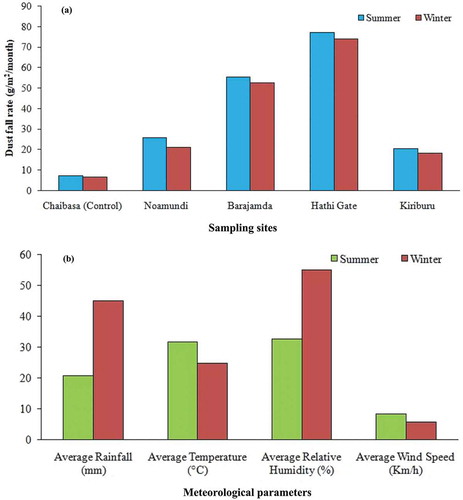
Table 2. Comparison of dust fall rate of Copper and Iron mining area with other cities in the world
Table 3. Threshold limit values of dustfall rate (Narayan et al. Citation1994)
Table 4. Percentage of occurrence of mineralogical compositions of atmospheric dustfall in copper and iron mining area (+ = present, − = absent)
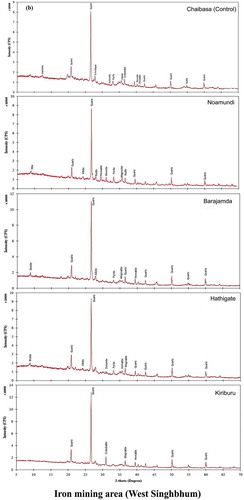
Figure 4. (a) XRD of the atmospheric dust sample collected from copper mining area. (b) XRD of the atmospheric dust sample collected from iron mining area
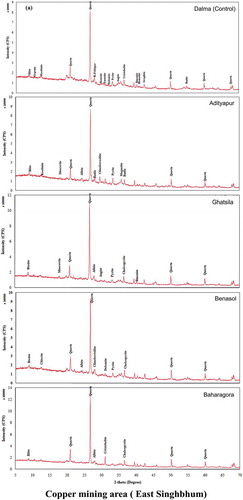
Figure 4. (Continued)